 Protocol
Author names
Zachary A. Brown, James L. King, Thomas Hanley, Adrienne B. Nicotra, Greg S. Jolley
Author affiliations/Institutions
The Australian National University
Overview
To understand plant and soil responses to a warmer, drier future, we designed and implemented a whole soil profile heating x drought experiment in a subalpine grassland. Temperature manipulation is provided through active soil heating and augmented with passive heating via polycarbonate walls. Incident rainfall is reduced using polycarbonate roof gutters.
Background
Climate change is predicted to cause widespread shifts in temperature and precipitation regimes that could have dramatic effects on individual species, ecosystems and the carbon balance (IPCC, 2014). A warmer, and in many cases, drier climate is rapidly approaching so it is imperative to begin to understand these effects as soon as possible. An effective way to study this is through in situ climate manipulation experiments. The benefit of in situ experiments is that all other biotic and abiotic variables remain in place that are otherwise impossible to simulate within a lab, creating a realistic scenario. Single factor experiments are relatively common across the globe. Multi-factor experiments however, require significantly more investments in funding and resources and are less common. In a meta-analysis looking at field manipulative experiments within grasslands of heat, drought, irrigation and combinations therein, less than 4% of study sites analysed the interaction of warming and drought (Liu et al., 2021). Factorial experiments are also important for the fact that climatic factors often have interactive effects that are more complex than their individual factors (Hussain et al., 2019).
This method was developed as part of the Australian Mountain Research Facility (AMRF) to simulate future climate conditions in a subalpine grassland to study organism, community, and ecosystem process responses to rising temperatures and reduced water availability.
Passive incident rainfall reduction was carried out using simple rainout shelter design. A buried heating structure was designed based on the structure presented in Hanson (2011) and implemented in other study systems (Nottingham 2020). Importantly, this study demonstrated the suitability of solar as a power supply, which, to the best of our knowledge, has not been used in such experiments to date.
We were successful in imposing the treatments we set out to achieve. Soil temperature (Figure 1 A and B) were maintained at 4 degrees above ambient throughout the snow-free season. Soil volumetric water content was kept below the ambient treatments outside of major precipitation events (Figure 1 C and D). Relative humidity was largely unchanged (Figure 1 E) and air temperature was generally kept above ambient during the day as a result of the polycarbonate side panels (Figure 1 F).
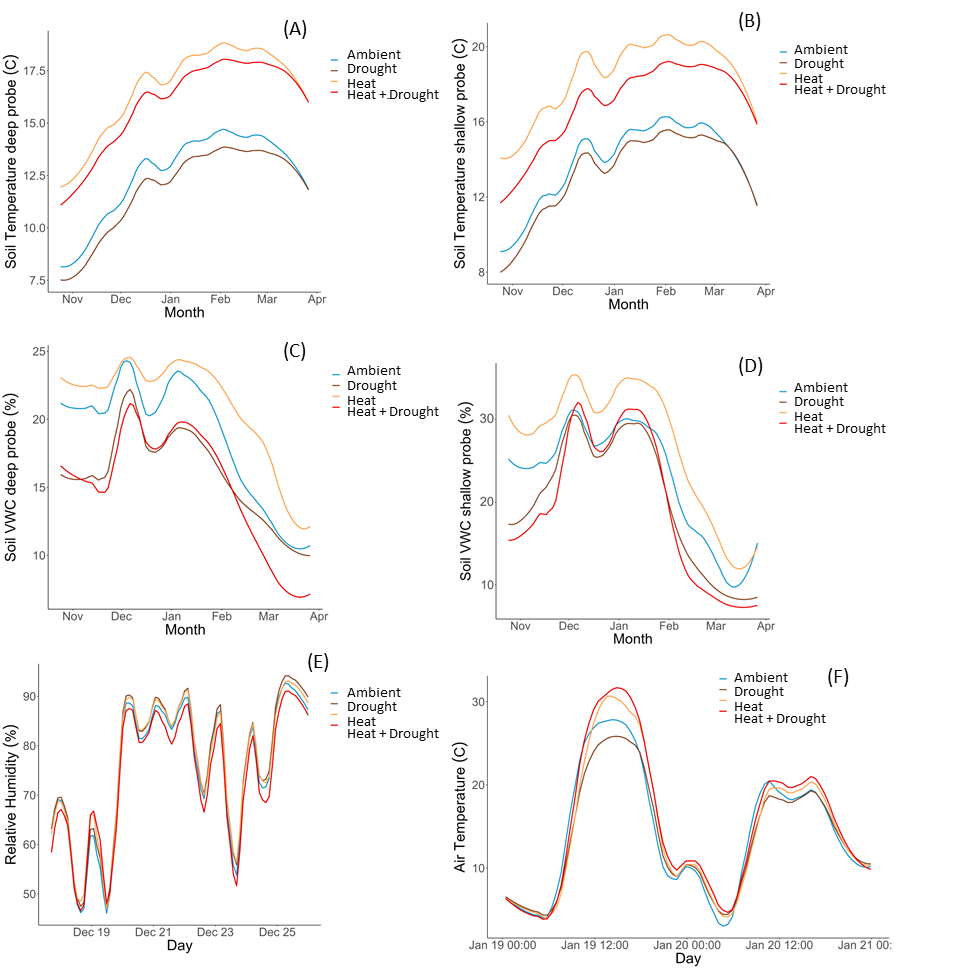
Figure 1. Abiotic conditions imposed as a result of Heat x Drought treatments including seasonal soil temperature deep probe at 45-55 cm (A), seasonal soil temperature shallow probe at 10-20 cm (B), seasonal soil volumetric water content (VWC) deep probe at 45-55 cm (C), seasonal soil volumetric water content shallow probe 10-20 cm (D), relative humidity over one week in December (E) and air temperature over two days in January (F).
This design allowed for the study of soil and vegetation processes in an intact subalpine grassland exposed to future temperature and moisture conditions. Efficient use of the treatment area allowed for numerous co-occurring projects over many years. We focussed efforts on plant community dynamics, phenology, productivity, carbon dynamics, soil microbial community, soil invertebrates, and ecophysiological studies on pre-existing and transplanted specimens.
Materials/Equipment
This study included 5 blocks each containing a factorial combination of Heat, Drought, Heat+Drought and Ambient conditions. These sensors are required for one complete block.
- 1 x CR1000X datalogger (Campbell Scientific, Logan, Utah, USA)
- 8 x CS655 soil probes (Campbell Scientific, Logan, Utah, USA)
- 4 x MX2301A relative humidity / air temperature HOBO (Onset, Bourne, Massachusetts, USA)
- 4 x 10⁷ Temperature probe (Campbell Scientific, Logan, Utah, USA)
- Weather-appropriate enclosure for datalogger. We used Switches Plus Components FT604030 Steel Enclosure
Structural materials required:
- 3 mm polycarbonate sheets for walls and roofing panels
- 40mm hollow square section steel for rainout shelter
- stainless steel hardware (e.g. nuts, bolts, washers) for assembly of shelters
- 700mm long circular stainless-steel pipes for heater element housing
- stainless-steel conduit and conduit connector kits
- resistance wire
- sand
Installation materials:
- battery powered soil augur (100 cm length x 4 cm width)
- fence bar / crowbar
- basic hand tools (shovel, trowel, tarpaulins, measuring tapes, etc)
- power drill and spare drill bits
- roofing screws
- 1-m soil probe
- transect tape
- builders string
- flagging tape
- tent pegs
Power supply – mains (much simpler) or 24 V solar (as used by authors). For one block:
- 2 x Smartsolar MPPT 150V/45A charge controller (Victron)
- 16 x 24V 215W Monocrystalline solar panel (Victron)
- 8 x 12V 100Ah AGM supercycle battery (Victron)
- solar panel racks
- 2 x pelican case for batteries
- 2 x watertight enclosure and rack for electronics
- miscellaneous solar components for solar array
Procedure
Site description and plot layout
FutureClim was established in October 2022 in a subalpine grassland in Kosciuszko National Park, New South Wales, Australia. The experimental plots were located between 1600 m and 1615 m a.s.l. (-36.372358° 148.431196°). Between 2010 and 2024, the mean maximum and minimum air temperature was 11.0°C and 1.4°C respectively with a mean annual precipitation of 2253.5 mm (Perisher Valley Station 071075, Australian Bureau of Meteorology).
The experiment was a factorial Heat x Drought design. Each block contained four plots designated the following treatments:
- Ambient (no temperature or rainfall manipulation).
- Heat (4°C soil temperature above Ambient soil temperature),
- Drought (80% reduced incident rainfall), and
- Heat+Drought (4°C soil temperature above Drought soil temperature and 80% reduced incident rainfall).
There were five such blocks contained within the site area for a total of 20 experimental plots (Figure 2). Each plot was situated within a 3 x 3 m steel frame shelter (Figure 3). Drought and Heat+Drought shelters were equipped with clear, sloping roof panels covering 80% of roof area. Heat and Heat+Drought plots contained a buried heating structure (described below) and polycarbonate wall panels for passive heating. Drought and Ambient plot shelters were equipped with mesh walls to exclude large mammals. The sampling area under each plot was 2 x 2 m, providing a 50 cm buffer area where no measurements were collected. All shelters have a single point for worker access that is closed when workers are absent. All power was provided via 10 independent solar arrays, each of which powers one heated plot.

Figure 2. Map of the FutureClim experimental site. Green squares mark the location of each experimental block. From west to east is Block 1 through Block 5.

Figure 3. Pictures of the FutureClim experiment in operation including pictures of Heat and Heat+Drought plots (A-B), an Ambient plot under snow (C), a Heat+Drought plot under snow (D), a species composition survey underway (E), and finally a soil respiration measurement using a LI-6400 (F).
Heating structure
- The heating structure consists of seven 70 cm x 7 cm (L x W) cylindrical Stainless-steel rods, connected by approximately 100 cm of flexible stainless-steel conduit into a chain. Stainless-steel T-junctions were welded to the top of each rod to adjoin conduit. Soil depth in our site is relatively shallow and the majority of roots are in the top 30 cm, thus we chose 80 cm heating depth to capture the majority of biologically active soil space. In other experiments (e.g. Nottingham 2020) with deeper soil longer heating rods have been used.
- A single length of resistance wire was threaded through the conduit and the heating rods. Conduit contained a single length of wire while each heating rod contained several lengths of wire. This resulted in approximately 22 m of resistance wire in each plot with most of this positioned below the conduit (i.e > 10 cm soil depth). Regular Teflon coated copper wire was chosen as the resistance wire primarily because of its suitability for the task of creating a distributed heater operating off a 24 volt supply. The total length of wire and gauge were chosen to provide about 400 Watts of heating power for a 24 V supply.
- The heating rods and conduit were then filled with dry play sand. Once filled, stainless-steel covers were fastened with screws to the T-junctions welded at the top of each heating rod to create an air-tight seal.
Installation of heating structures
The following protocol was followed for all plots regardless of treatment to disturb experimental areas equally.
- Each plot area was designated by measuring a 3 x 3 m square with a 2 x 2 m internal square to denote the measurement area. The larger square denoted the location for the shelter and indicated a 50 cm buffer strip for worker access. Foot traffic and unnecessary disturbance to the measurement area was minimized.
- The soil probe was systematically pushed into the soil to identify and mark the location of any large rocks within the plot boundary. Each heating structure was custom designed to avoid large rocks and roots within the respective plot. This minimised disturbance to the soil profile.
- Seven 80-cm deep holes were augured, with six holes evenly spaced about the circumference of the 2-m diameter ring within the measurement area and one in the center of the plot. These were place holders for where heating rods were expected to be buried.
- Using a long-handled spade, a trench was cut for the placement of the heating structure conduit. The trench started at the centre auger hole and extended around the diameter of the 2-m internal plot with approximately 10 cm width and 15 cm depth. Vegetation and soil were kept intact as possible and folded back or set aside. Note that this was done in all plots to disturb all plots equally.
- With the sections of soil and vegetation removed, the heating structure was placed in the base of the trench and heating rods were inserted into the augured holes. Vegetation and soil sections were returned to their original positions. Loose soil was used to fill any voids around heating rods, conduit and soil sections, tamping as necessary to fill air spaces.
Shelters
- A shelter frame built of 40 mm tubular steel was deployed atop each plot. The shelters had base dimensions 3 x 3 m with a sloping roof with maximum height of 1.3 m and minimum height of 1.1 m. The legs of the shelter terminated in a welded metal foot and were situated in the corners of the 3 x 3 m plot area. For each shelter, the tallest side faced uphill and northward.
- Roofing panels were fabricated by first cutting 3 mm polycarbonate into 300 cm x 30 cm pieces. A 5 cm wide, 90° bend was made along both long edges of each sheet to create a 300 cm x 20 cm gutter using a hydraulic sheet metal folder. Twelve such gutters were evenly spaced on each shelter roof and secured using self-tapping roofing screws and a cordless power drill.
- Shelter walls were cut of 3 mm thick polycarbonate to the same dimensions of the shelter walls. These panels were secured to the shelter sides using self-tapping roofing screws. A removable polycarbonate door was affixed to one side of each shelter to allow worker access.
Power supply
Power was delivered via standalone solar arrays. Each block contained two arrays of eight solar panels each. Each array was connected to four 12V AGM batteries that were wired in series and parallel to create a 24V 200Ah battery bank. A solar charge controller was used between the solar array and battery bank to manage charging of the batteries. One array provided the power to one of the heated plots within each block. In each block, one array powered the datalogger as well as the heater.
Heating control system
The buried heating structure was intended to deliver 4°C soil temperature above Ambient soil temperature (or Drought soil temp for the Heat+Drought plot). To accomplish this, a datalogger and soil temperature probes were used as a thermostat between a heated plot and its paired plot (i.e. Heat and Ambient or Heat+Drought v Drought).
- Two soil probes (CS655 Campbell Scientific) were deployed in each plot to measure soil temperature, soil volumetric water content, and soil electrical conductivity. A narrow trench was created at the midway point between the central heater and the heater ring directly beneath the conduit running to the central heater. A soil probe was inserted at a 45 degree downward angle at a depth of 45 cm and a second probe was similarly inserted at 10 cm. A temperature probe (CS107; Campbell Scientific) was buried at 30 cm directly adjacent to one heating rod and was used for calibration of the heaters. All soil probes within a block were connected to a datalogger (CR1000X; Campbell Scientific), which recorded soil temperature, soil volumetric water content, and soil electrical conductivity 5 min-1. Heater surface temperature was recorded 1 min-1.
- Each heating and control plot pair was connected to a thermostat system, which maintained soil temperature of Heated plots 4°C above Ambient. The thermostat was composed of a datalogger, a mosfet transistor, and one soil probe buried at 45-55 cm in each plot pair. The program script was written such that a heater was toggled on via the transistor only when the difference in soil temperature between plot pairs (i.e. Heated minus Ambient or Heated+Drought minus Drought) was less than 4°C. The temperature was measured and adjusted 5 mins-1 by this method. Power was supplied to the heaters from a 24 V solar array. A power inverter was used to supply 12 V to the datalogger.
- The plot sensors recorded data year-round. However, active heating was provided only when day length enabled sufficient solar power generation to deliver heat treatments. For example, the heating treatment commenced in November 2022 (Austral spring) and was continued to May 2023 (Austral autumn). The heaters were turned on again in October 2023 and were turned off in May 2024. When heaters were turned on for the season, temperature was set to increase by 1°C wk-1 until 4°C above ambient was achieved. Similarly, at the season end, the program was set to ramp down by 1°C wk-1 until heated plots and control plots are at ambient temperature.
Environmental monitoring
- A relative humidity and air temperature sensor was installed in the centre of each plot. Each sensor was contained inside a plastic radiation shield and was mounted on a wooden stake at 25 cm height, just above the vegetation canopy. Measurements were recorded internally 30 min-1.
Notes and troubleshooting tips
The authors’ earliest attempts at delivering active heating treatments using solar included comparison of the average soil temperature across the shallow and deep soil probes in the plot pairs. Inclusion of the shallow soil temperature in the program was problematic because of the high variability in soil surface temperature due to diurnal patterns and rapidly changing weather. The heating elements were unable to respond to these temperature variations, resulting in ineffective temperature control and a dramatically higher power requirement. The implemented program measured both soil depths but uses only the deep soil temperature for the thermostat control. Deep soils are substantive thermal mass and are not rapidly influenced by weather conditions or diurnal cycles. This property stabilised temperatures and provided near-uniform heating throughout the treatment area.
The authors intend to implement a proportional-integral-derivative (PID) controller in the future. This would allow for fine tuning of temperature control and, therefore, the amount of power required to heat the plots. There exists a lag in the thermostat. This is partially due to the soil temperature measurements collected 5 mins-1. This causes a lag in the toggling of the heating structures. More critically, the heating structures take a substantial amount of time to heat or cool off. Therefore, the system is unable to rapidly increase or decrease soil temperature. A PID controller would require substantially more intensive monitoring and configuration to appropriately calibrate. The use of this would allow finer control over heating delivery and would likely reduce power requirements. The authors intend to update this protocol with instructions for this feature if it is integrated into the heater program.
Use of this experimental design is ideal for experiments in intact environments without access to mains power. This of course allows researchers to study climate change impacts on intact systems. However, the authors strongly encourage the use of mains power rather than solar if possible. Solar setups require additional materials that can be challenging to move to site. Also, the array capacity will limit the capability of the experiment in low-light conditions.
The Australian Mountain Research Facility (LE190100039 ) was funded by the Australian Research Council Linkage, Infrastructure, Equipment and Facilities (LIEF) with financial support from our partners at New South Wales Department of Climate Change, Energy, the Environment, and Water as well as many universities including The Australian National University, Deakin University, University of Canberra, University of Tasmania, and University of New South Wales.
Links to resources and suppliers
Australian Mountain Research Facility https://www.amrf.org.au/
Campbell Scientific Australia https://www.campbellsci.com.au/
Attached is the CR1000X datalogger script written in CRBasic. Guides to CRBasic can be found online.
Literature references
Hanson P, Childs K, Wullschleger S, Riggs J, Thomas W, Todd D, Warren J (2011) A method for experimental heating of intact soil profiles for application to climate change experiments. Global Change Biology 17, 1083–1096. doi:10.1111/j.1365-2486.2010.02221.x
Hussain, H.A., Men, S., Hussain, S., Chen, Y., Ali, S., Zhang, S., Zhang, K., Li, Y., Xu, Q., Liao, C. and Wang, L. (2019) Interactive effects of drought and heat stresses on morpho-physiological attributes, yield, nutrient uptake and oxidative status in maize hybrids. Scientific reports 9(1), p.3890. doi: 10.1038/s41598-019-40362-7
IPCC, 2014: Climate Change 2014: Synthesis Report. Contribution of Working Groups I, II and III to the Fifth Assessment Report of the Intergovernmental Panel on Climate Change [Core Writing Team, R.K. Pachauri and L.A. Meyer (eds.)]. IPCC, Geneva, Switzerland, 151 pp.
Liu, D., Zhang, C., Ogaya, R., Fernández‐Martínez, M., Pugh, T. A., & Peñuelas, J. (2021) Increasing climatic sensitivity of global grassland vegetation biomass and species diversity correlates with water availability. New Phytologist, 230(5), 1761-1771. doi: 10.1111/nph.17269
Nottingham, A.T., Meir, P., Velasquez, E. Turner, B.L. (2020) Soil carbon loss by experimental warming in a tropical forest. Nature 584, 234–237. doi.org/10.1038/s41586-020-2566-4
Health, safety & hazardous waste disposal considerations
All electrical work should be carried out with care and by a licensed electrician. All work with electronics poses a significant fire risk. Risk assessments should be carried out with trained professionals prior to commencement of the activity. The authors of this protocol carry no responsibility for any harm following the use of this protocol.