 Summary
Protocols for experimental plot sampling, handling and processing of cereal experiments: Standardised methods for use in large agronomic, physiological and genetic field studies
Authors
G.J. Rebetzkeaf, A. van Herwaardenb, B. Biddulphc, C. Moellerd, R. Richardsa, A. Ratteya, K. Chenue
Author Affiliations
aCSIRO Plant Industry, PO Box 1600, Canberra ACT 2601
bCSIRO Plant Industry, QBP, Brisbane QLD 4067
cDAFWA, Locked Bag 4, Bentley Delivery Centre WA 6983
dUni. Sydney, 1 Central Ave, Eveleigh NSW 2015
eQAAFI, PO Box 102, Toowoomba Qld 4350
fcorresponding author (Greg.Rebetzke@csiro.au)
Overview
Improving crop productivity is a priority for securing food security throughout the world. Ongoing research requires continual assessment and validation in field experiments representative of the target environments in which improved varieties or management protocols are aimed at delivery.
Why is there a need for this manual
Field experiments are typically undertaken under conditions where some, but not all variables, can be controlled. These sometimes represent a particular stress (eg drought, nutrient or temperature), conditions typical of the growing region, or very favourable conditions where the aim is to understand physiological and agronomic factors contributing to yield potential. Similarly, assessment of genotypes under a controlled stress requires an understanding and reporting of factors contributing to their differential performance in response to stress. If some of the observed differences in yield relate to differences in flowering, or greater leaf area development then the cataloguing of such variation must be undertaken.
Measuring and reporting of this variation can be varied. This makes interpretation across multiple experiments difficult as one researcher may view and undertake sampling differently to another. It is critical that there is consistency in how measurements are undertaken and reported. Hence, standardising measures and phenotyping among workers will provide data (and a growing database!) that is robust, reliable and repeatable. This will lead to more cost-efficient research where high quality data can be re-used to test new hypotheses and explore larger datasets possibly collected across various projects.
This manual reflects our thoughts on the basic set of critical measurements needed to characterise line performance in an environment. Both measurements and their methodology are organised according to timing within the experiment/crop cycle using the cereal development score (‘DC’ for Decimal Code – Appendix 1 and Appendix 2). We strongly advise that plots typically contain two outer rows (-edge’ or -border’) and multiple inner rows to minimise any inter-plot competition effect, e.g. edge effects due to shading, nutrients, water availability, or compaction. As abiotic stresses (water, temperature) are often a focus of research, plots should be managed with the aim of minimising constraints afforded by inadequate nutrition and incidence of pests (weeds, insects and diseases). We believe that effective phenotyping should require a set of core measurements to be taken on all lines in an experiment. These measurements need to be simple, reliable and repeatable, and potentially allow screening of large amounts of lines across environments.
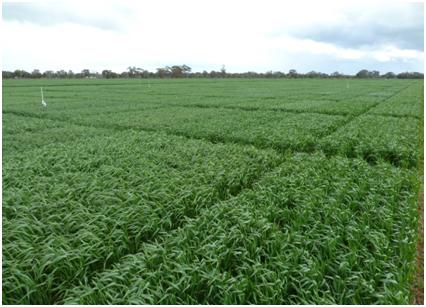
Figure 1. Irrigated plots in a large breeding experiment.
Download complete manual: Protocols for cereal field experiments_Nov2012.pdf
Index
Before the experiment
Importance of good site characterisation
Plot type and size
Preschedules – the plan for the experiment
Measurements
Diary (experiment details from before sowing onward)
Which plant measurement When For what
Climatic measurements
Plant establishment counts (Zadok DC12-13)
Ground cover assessments (DC12+)
Canopy light interception assessment (DC20+)
Leaf area/biomass at five-leaf stage (DC15) to start of stem elongation (DC31)
Assessing plant and crop development (DC29+)
Sample preparation for Transpiration Efficiency using Carbon Isotope Discrimination (DC30-32)
Leaf and root/crown disease scoring (DC12 – maturity)
Tips for managing fungal diseases in the field
Measuring crop canopy temperature (DC37+)
Anthesis (flowering) (DC65) – Sampling for biomass and WSC/N determination
Anthesis (flowering) (DC65) – Observation of other leaf attributes
Extreme temperature damage (DC60+)
Maturity height, lodging scores, and shattering score (DC92+)
Maturity (DC92+) harvest index, biomass and spike number samples – Quadrat cut and sub-sampling
Grain size, hectolitre weight and screenings determination (DC93+)
Maturity machine harvest samples (DC93+)
Appendices
Appendix 1: Zadok/decimal code table of growth stages
Appendix 2: Zadok/decimal code illustrations
Appendix 3: Soil water measurements
Appendix 4: Soil nutrition