 Protocol
Author
Katy Sommerville
Overview
This protocol outlines how to create chlorophyll fluorescence induction curves and associated images using a Waltz Imaging-PAM with standard measuring head.
Background
This protocol explains how to use the Imaging-PAM instrument to obtain data that can be used to calculate the maximum efficiency of photosystem II, non-photochemical quenching, quenching coefficients and other factors useful in monitoring photosynthetic performance in plants. The Imaging-PAM allows these factors to be visualized in different parts of a leaf such that spatial differences in response to some stimuli may be monitored.
Materials/Equipment
- Waltz Imaging-PAM chlorophyll Fluorometer
- Light meter
- ImagingWin software and a computer to run it on
- Ruler
Units, terms, definitions
PAR – photosynthetically active radiation
AL – actinic light
R – red light
NIR – near infra-red light, see NIR spectrophotometer
LED – light emitting diode
AOI – area of interest
Procedure
Set-up
Plug the computer into mains power via the cord provided. Next, take the yellow Imaging-PAM chlorophyll Fluorometer box and plug the AC adapter into the slot marked -charge’ with the other end plugged into mains power. Connect the cord marked -RS232′ from the yellow box to the computer.
You will now need to assemble the camera and LED ring on the stand provided. First attach the LED ring such that it sits below the camera. A distance of approximately 70 mm between the LED ring and where your leaf will sit is best, although you may need a larger distance if the area of leaf you wish to image is large. Once the camera and ring are assembled you can then connect the provided cord between the camera itself and the slot marked -camera’ in the yellow box. Next connect the cord from the LED ring to the -standard head’ slot on the yellow box. Finally, connect the remaining cord between the camera and the computer. Depending upon the ports available with your computer, you may need a converter to insert this cord at the computer end.
Starting the system
First turn on the yellow box (make sure power is on at the wall socket) and then turn on the computer.
Once the computer has started you can open the software -ImagingWin’. The PAM will start flashing blue light intermittently (this is a good sign). The ImagingWin software will ask you to select a measurement head. Select -standard’ (it should automatically default to this setting). The ImagingWin program will then open in full. There will be five different tabs -Image’, “Kinetics’, -Light curve’, -Report’ and -Settings’ through which you can navigate.
Calibration
Before making measurements there are a number of calibration steps you will need to complete.
You will need to modify PAR values for the 20 actinic light intensity settings. Existing PAR values can be found under AL List/ -LED currents/PAR values’ in the menu at the top of the ImagingWin program.
You will need to use an independent light meter, measure and record the PAR values at the level at which you will be measuring your leaf. Go to the -settings’ tab, in the -Act. Light’ box select -Int.’ 1. Then go to the -Image’ tab, deselect -ML’ and select -AL’. Note down the PAR reading from your light meter. Repeat this for all 20 -Int.’ settings.
Locate the INI file in the Imaging-PAM directory and adjust the 20 PAR values accordingly. The original PAR list determined at the factory can be restored under settings, reset/PAR list. Don’t change the camera position (apart from focus changes) once you have set the modified PAR values.
Before you can measure how much PAR your leaf is absorbing you need to check to see if the R and NIR light intensities and red gain need adjusting using the white standard (this standard will have arrived with the Imaging-PAM). The R and NIR images of the white standard should show similar brightness values when you press the -measure abs’ button in the -Image’ tab.
If the R and NIR values differ by less than 5% then no corrections are necessary. However, if the difference is greater than 5% you should adjust the red gain in the INI file within the Imaging-PAM directory. Before changing these values you will have to quit the ImagingWin program. It is recommended that you consult the Imaging-PAM instruction manual for details on this procedure.
There is always some difference in pixel values over the imaged area such that image intensity will decrease from the middle to the fringe. This can be compensated for using a fluorescence standard (this standard will have arrived with the Imaging-PAM). Images created of this standard, correction images, have to be measured at the same working distance at which experiments are done. Once created, correction images should be stored for minimal (closest to the leaf) and maximal (furthest from the leaf) working distances, and for user defined distances (actual distance used in measurements). To do this go to the -Settings’ tab, in the -Image correction’ box select -minimal’ then press the -Measure’ button. Do this for all working distances.
Settings for your plant
Before taking measurements you will need to adjust some settings to suit your study plants. For some plants the default settings may be adequate but this should always be checked. Click on the settings tab at the top of the program screen.
Before you begin measuring induction curves it is best to test the light intensity required to initiate quenching in your particular study plants. To do this you should construct a number of test light response curves. You can create a light response curve using the Imaging-PAM but it is important to keep in mind that this curve is not a -normal’ light response curve but reflects the estimated electron transport rate. Once you have determined light necessary to induce quenching you can adjust the actinic light (AL) setting to reflect this i.e. you might set AL to light setting -9′ which you have previously determined, using your light meter, to be 150 μmol m-2s-1.
Before beginning your experiment you should run some trial induction curves to work out how long it takes you to get steady readings in the light (quenching) part of the curve for your plants. You may need to run the induction curve for longer and with more measurement points if your fluorescence emission rises initially.
Here are some example settings used in the creation of induction curves for Australian Acacia plants:
Image correction: set to -actual area’
Sat pulse: interval set to -30′
Slow induction: Delay set to 60 seconds
Clock set to 30 seconds
Duration set to 415 seconds
Clock: SAT-Pulse set to 30 seconds
AL set to 10
You will need to re-enter your settings when you restart your computer for a new set of measurements each day.
Begin measurements
Click on the image tab. In the -select’ box you will have two choices, fluorescence (which should be automatically selected when you start the ImagingWin program) and Live video. Live video is the best mode in which to focus the image of the leaf. Click on -Live video’.
The leaf Take your dark adapted plant and place it in a position such that the leaf you want to image is close to the Imaging-PAM. You may want to place the plant on a platform and adjust the angle of the plant pot using bricks to tilt the top of plant toward the Imaging-PAM.
Maneuver your leaf into the measurement area of the PAM. Secure the black square plate (leaf holder) over the top of the leaf using the two black plastic arms attached to the base plate (Figure 1). If the leaf is quite curly or raised you may need to use nylon thread attached to the leaf holder to keep the leaf flat.

Figure 1: Positioning of leaf in Imaging-PAM leaf-holder
Focusing the image Now the leaf is in place you can focus the image by turning the lens ring left or right (you will need to stick your finger inside the black light emitting ring from the top). Once satisfied you have focused the image as best you can, close the Live video mode by clicking on the cross at the top right of the Live video box (Figure 2). Blue flashes should then begin again and you should be able to see your leaf on screen (it will probably be yellow and orange in color).
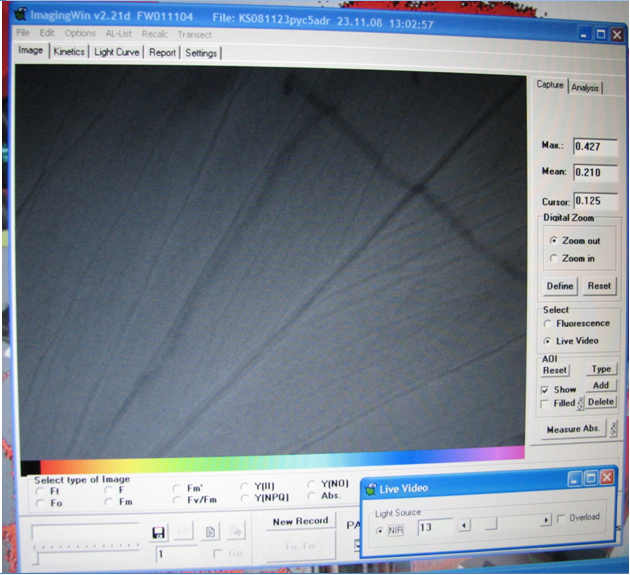
Figure 2: ImagingWin software showing view of leaf in live video mode
Selecting areas of interest You now need to choose your AOI (if you don’t select these then the Imaging-PAM won’t make measurements). Firstly, go to the AOI box and press on the -Reset’ button. Next press the -Add’ button. Float the cursor over the image. You should see a big black circle (you can also select a square or polygon). If you need to make this circle smaller select the –‘ key on the keyboard until the circle reaches the size you require. You now need to select a part of the image that you want to measure. Choose as many areas as you require (Figure 3). For instance, you may wish to measure areas at different distances from a major vein.

Figure 3: Acacia pycnantha Fm‘ image showing areas of interest (AOI) as black circles with values adjacent
Once you have added your AOIs then you are ready to begin making measurements.
Starting the induction curve Choose the Kinetics tab. Press the -Start’ button and watch as the induction curve is created. When the curve is finished you should return to the image and press the -measure abs’ (absorptivity) button. The absorptivity tells you how much red light is absorbed by your leaf.
Saving the data Next go to the save icon in the bottom left corner of the program screen. Press this button. Save the image (and associated data) as a -pim’ file (this should come up as the default choice).
After you press the save button you will then be presented with a text box in which you can write any comments you think are relevant to the measurement.
Starting the next measurement Now you’ve finished the measurement for your first leaf, select the second leaf and start again.
When you start the next induction curve it will ask you if you want to save the previous record and if you want to save the previously determined Fo and Fm. Select -No’ or -Nein’ in answer to both questions.
Accessing and utilizing the images and data
To view the images and associated data you will need the software ImagingWin. When you open the program whilst not connected to the Imaging-PAM you will get a message “No camera found, running in demo mode!” Press -OK’ and select -standard’ as your measuring head type. Opening your -pim’ files in this software you will be able to see the same screen image as you did when collecting images using the Imaging-PAM. You can also change AOI at this point if you wish.
Go to the -Report’ tab and select the parameters which interest you e.g. Fo‘, Fm‘. At the top of the report tab you will find a button with a red arrow. If you float your mouse over it you will see -Export selected recording as csv file’. Press this button. Data will then be saved into the file -export.csv’ in C:ImagingPamData_STD (unless you have specified another location). Open this file in a spreadsheet and save it under a new name. Data is then available for manipulation as you wish.
Notes and troubleshooting tips
If, for some reason the blue light gets stuck on during an induction curve you need to press -stop’ and then restart the program (re-entering the settings) and dark adapt the leaf again. If the blue light gets stuck on during an absorptivity measurement then simply press the -measure abs’ button again and the new measurement will overwrite the erroneous one.
Links to resources and suppliers
The Imaging-PAM chlorophyll Fluorometer instruction manual can be found at the Waltz website. This document includes important and detailed instruction on settings, measured parameters and calibration of your instrument. It is recommended reading. The ImagingWin software can be downloaded from the Waltz website free of charge.
Literature references
Adams WW, Demmig-Adams B (2004) Chlorophyll fluorescence as a tool to monitor plant responses to the environment. In ‘Chlorophyll a fluorescence: a signature of photosynthesis. Vol. 19.’ (Eds GC Papageorgiou and Govindjee) pp. 583-604. (Springer: Dordrecht)
Baker NR (2008) Chlorophyll fluorescence: a probe of photosynthesis in vivo. Annual Review of Plant Biology 59(1), 89-113.
Bolhàr-Nordenkampf HR, Öquist G (1993) Chlorophyll fluorescence as a tool in photosynthesis research. In ‘Photosynthesis and production in a changing environment: a field and laboratory manual.’ (Eds DO Hall, JMO Scurlock and SP Long). (Chapman & Hall: London)
Krause GH, Weis E (1991) Chlorophyll Fluorescence and Photosynthesis: The Basics. Annual Review of Plant Physiology and Plant Molecular Biology 42(1), 313-349.
Schreiber U, Bilger W (1987) Rapid assessment of stress effects on plant leaves by chlorophyll fluorescence measurements. In ‘Plant responses to stress. Vol. G15.’ Ed. JD Tenhunen). (Springer-Verlag: Berlin)