 Summary
Contributing Editors
Margaret Barbour and John Evans
Summary
Isotopes are atoms containing additional neutrons, and can be either stable or radioactive. Because the atoms contain the same number of electrons and protons as the common isotopes, they are involved in the same biochemical reactions and physical processes. However, the extra neutrons increase the mass of the atom and mean that reactions and processes can occur at altered rates. For example, a CO2 molecule containing a 13C atom rather than a 12C atom diffuses 0.0028% more slowly through air.
Isotopes are a very important component of the plant physiological ecologist’s tool kit. Isotopes may be applied in plant physiological ecology studies in two ways;
- as tracers to follow atoms through systems (both stable isotopes and radioactive isotopes),
- and as a record of biophysical processes if the process of interest results in changes in the ratio of rare to common isotopes (stable isotopes).
We divide the isotope section into stable isotopes and radiocarbon, as these are the two most commonly-used approaches in plant physiological ecology. We also include a separate section on stable isotopic optical spectroscopic techniques (including tunable diode laser absorption spectrometry and cavity ring down laser absorption spectrometry).
Stable isotopes
Definitions
Stable isotopes are naturally occurring, non-radioactive isotopes of atoms, containing additional neutrons compared to the common isotope. There are four main stable isotopes of interest, namely; carbon-13, nitrogen-15, oxygen-18 and deuterium.
Table 1: Characteristics of the four commonly used stable isotopes
| Isotope | Natural abundance | Substance | Standard | Rstandard | Typical precision (mass spec.) | Range |
| 13C | 1.1% | Organics | VPDB | 0.0111802 | 0.1‰ | -10 to -31‰ |
| 13C | 1.1% | CO2 | VPDB | 0.0111802 | 0.1‰ | -3 to -30‰ |
| 15N | 0.37% | Organics | Air | 0.0036630 | 0.2‰ | 15 to +20‰ |
| 18O | 0.204% | Organics | VSMOW | 0.0020052 | 0.2‰ | 10 to 40‰ |
| 18O | 0.204% | CO2 | VPDB-CO2 | 0.0020672 | 0.2‰ | -5 to +5‰ |
| 18O | 0.204% | H2O | VSMOW | 0.0020052 | 0.2‰ | -25 to +25‰ |
| 2H | 0.015% | Organics | VSMOW | 0.0001557 | 1.0‰ | -200 to +100‰ |
| 2H | 0.015% | H2O | VSMOW | 0.0001557 | 0.7‰ | -200 to +200‰ |
Until very recently it was difficult to measure the absolute concentrations of individual isotopologues (but see section on isotope laser techniques below). Isotope compositions are routinely measured on an isotope ratio mass spectrometer![]() as a difference in composition compared to a standard. At natural abundance, compositions are usually expressed in units of per mil (‰), i.e. parts per thousand.
as a difference in composition compared to a standard. At natural abundance, compositions are usually expressed in units of per mil (‰), i.e. parts per thousand.
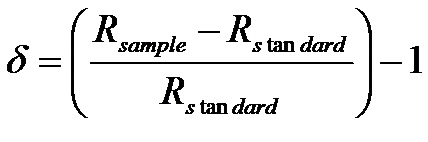 (1) , where (using 13C of CO2 as an example)
 (2)
(2)
Values of R for standards, and typical values for at natural abundance are shown in Table 1. In plant physiology we are often interested in the difference in isotope composition as a result of a particular process. This is referred to as isotope discrimination, and is calculated from the difference between the substrate and the product:
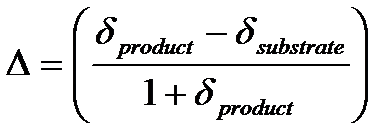 (3) , again expressed in ‰.
However, tracer studies employing highly enriched compounds use a different notation to express isotope compositions, because the notation in units of per mil produces inconveniently high values. In such studies, values are usually presented in atom % by (using 15N as an example)
 (4), in units of parts per hundred.
Labeling applications
See section on: 15N labeling
Natural abundance applications
See associated sections on:
Radiocarbon
Radiocarbon provides valuable information on terrestrial carbon cycling through, broadly speaking, a tracer-based approach. Radiocarbon is continually produced in the atmosphere by cosmic rays. The 14C nucleus is unstable and will emit a particle (i.e. an electron) to form 14N, with a half-life of 5730 years. The cosmogenic production is balanced by both mixing between the atmosphere, the ocean and terrestrial reserves and by radioactive decay so that the natural abundance of 14C in atmospheric CO2 is about one in every trillion carbon atoms (Trumbore 2009). However, atmospheric thermonuclear testing in the early 1960s added considerable quantities of radiocarbon to the atmosphere, and this provides a pulse of labelled carbon that may be used to trace carbon through systems (Broecher & Peng 1982; Levin & Hesshaimer 2000). Since testing ceased in 1964, the 14C/12C ratio in the northern hemisphere atmosphere has rapidly declined, firstly due to dilution into the southern hemisphere atmosphere and then due to mixing of atmospheric carbon with oceanic and terrestrial carbon pools (Randerson et al. 2002; Naegler & Levin 2006). Radioactive decay of carbon is limited on such short time scales. At the moment, the change in 14C/12C from one year to the next is greater than the precision of measurement, meaning that radiocarbon contents may be used to explore exchange between the atmosphere and a carbon pool of interest on time scales of annual to decadal (Trumbore 2009). For studies of this type, radiocarbon content is commonly reported in per mil (‰), as the 14C/12C ratio of the sample measured in a given year (y) to an absolute standard that does not change with time (that of the oxalic acid standard decay corrected to 1950):
 (5)
(5)
where [14C/12C]sample,-25 is the ratio of 14C to 12C, corrected for the mass-dependent isotope fractionation to a common value of -25‰. The mass-dependent fractionation of 14C can be corrected from the 13C of the same sample, and this is routinely applied during analysis. From 14C values, the -age’ of carbon may be determined. For example, using 14C Gaudinski et al. (2001) were able to demonstrate that fine roots of forest trees can live for more than a decade.
Laser absorption spectroscopic techniques
The recent development of spectroscopic techniques to measure concentrations of individual isotopologues (i.e. 12CO2 and 13CO2, for example) in gases and liquids has led to the rapid deployment of these instruments to measure isotopic effects in studies of plant physiology, soil processes and ecosystem exchange. The strong advantages of spectroscopic techniques over traditional mass spectrometry are the temporal resolution at which measurements can be made, and the ability to deploy the instruments in the field. The measurements are made on-line and in real time, and have greatly advanced our understanding of, for example, leaf respiratory biochemistry (e.g. Barbour et al. 2007a), coupling of canopy photosynthesis and ecosystem respiration (e.g. Kodama et al. 2009; Wingate et al. 2010 & in press), and partitioning between autotrophic and heterotrophic components of soil respiration (e.g. Millard et al. in press).
There are a number of instruments that measure isotopologue concentrations using laser absorption spectrometers, including :
Campbell Scientific TGA100A![]() (isotopes of CO2, isotopes of water vapour)
(isotopes of CO2, isotopes of water vapour)
Picarro G1101-i![]() (13C in CO2), L1102-i (isotopes of liquid water), L1115-i (isotopes of water vapour)
(13C in CO2), L1102-i (isotopes of liquid water), L1115-i (isotopes of water vapour)
Los Gatos Research model 908-0003![]() (13C in CO2), model 908-0008 (isotopes of liquid water), 908-0004 (isotopes of water vapour);
(13C in CO2), model 908-0008 (isotopes of liquid water), 908-0004 (isotopes of water vapour);
Aerodyne Research![]() (isotopes of CO2)
(isotopes of CO2)
To date, most studies have converted the isotopologue concentrations into the more familiar delta notation, relative to the usual standards. Using the isotopologues of CO2 as an example, the equations required to produce delta values from isotopologue concentrations are given below.
The oxygen ( 18OVPDB-CO2) and carbon ( 13C) isotope ratios of CO2, relative to the VPBD standard, are given by:
 (6) and
 (7)
(7)
where Rso and RVPDB-CO2 are the 18O/16O ratios of the sample and the VPDB-CO2 standard (0.0020883; Allison, Francey & Meijer 1995), and Rsc and RVPDBc are the 13C/12C ratios of the sample and the VPDB standard (0.011797; Zhang & Li 1990), respectively. Note that VPDB-CO2 is the isotope ratio of CO2 released by the VPDB carbonate, not the isotope ratio of the carbonate itself. Rsc is simply related to the isotopologue mixing ratio:
 (8)
(8)
but the two atoms of oxygen in CO2 mean that (Griffis et al. 2005)
 (9)
(9)
The isotope composition and total concentration of calibration cylinders for the instruments are usually measured by traditional techniques (IRGAs and IRMS), so the first step is to calculate the mixing ratios of the calibration cylinders:
 (10)
(10)
![]() (11)
(11)
![]() (12)
(12)
where fother is the fraction of CO2 containing all isotopologues other than 12C16O2, 13C16O2 and 12C16O18O, and is assumed to be 0.000821 (Eiler & Schauble 2004). The calibration cylinders must span the expected range in isotopologue concentrations of samples, but need not span the expected range in 13C or 18O (Bowling et al. 2003b). [CO2]]t for the sample air stream(s) is then calculated from the mixing ratios of individual isotopologues by
 (13)
(13)
and 18OVPDB-CO2 values are then calculated using Eqns 6 and 9. 18O values can also be presented relative to VSMOW, rather than VPDB, if 18O of CO2 is to be compared with 18O of water within the same study (e.g. Barbour et al. 2007b).
Most stable isotope absorption spectrometers measure isotopologue concentrations at very high temporal resolution, for example up to 10 Hz. This high temporal resolution is useful in studies employing micrometerological techniques, but may not be helpful for other studies because typically the precision is much lower at high temporal resolution. Often the average isotope compositions are calculated over a number of seconds.
Laser absorption spectrometers have been used to look at online photosynthetic and respiratory fractionation, at respiratory fractionation by heterotrophic plant tissues and by soils, and at higher scales to investigate ecosystem carbon cycling.
Literature References
Allison, Francey & Meijer 1995
Barbour et al. 2007a
Barbour et al. 2007b
Bowling et al. 2003b
Broecher & Peng 1982
Eiler & Schauble 2004
Gaudinski et al. 2001
Griffis et al. 2005
Kodama et al. 2009
Levin & Hesshaimer 2000
Millard et al. in press
Naegler & Levin 2006
Randerson et al. 2002
Trumbore 2009
Wingate et al. 2010 & in press
Zhang & Li 1990