 Protocol
Author
Lora Richards
Overview
This protocol outlines three main methods of measuring leaf herbivory rates. Each method will be described and the advantages and disadvantages of each one.
Background
This protocol explains how to measure herbivory rates. There are three common measurement tools used: qualitative, grid calculations and digital. A qualitative measurement entails that the investigator make a visual estimate of the percent leaf area missing. Alternatively, a transparent grid can be placed over the damaged leaf, and the leaf area removed and leaf area present can be calculated through counting grid squares. The third option entails taking a digital photograph or scanning the leaf and using a software program to measure the leaf area present and missing. The best measurement will depend on a project’s objective and study system.
An herbivory rate is generally thought of as the leaf area lost over a period of time (i.e. cm2/day) and is often expressed as a percentage of leaf area lost over time. Analyzing percentages can be useful when considering the effects of herbivory on individual plants and is often used for between species comparisons. In comparison, the actual herbivory rate (cm2/day) gives more information on the energy flow through the community. It is a good idea to evaluate both, since they have different interpretations. However, the key to an herbivory rate is that there is a time frame involved. The time frame will again depend on the project objective and study system. For example, in a temperate system it may be -growing season days’, while in a tropical system it may be -rainy season days’. This is different than measuring standing herbivore damage, where leaves may be randomly selected and the amount of herbivore damage is measured. This type of measurement should only be used when the age of the leaf is known (i.e. after a known leaf flush). Even if leaf age is known, there are still several components missing from this type of measurement. For example, 100% leaf herbivory is often missed. In addition, it is unknown when the damage occurred. This can be especially important when trying to link plant traits to herbivory. For example, in tropical forests, the vast majority of herbivory occurs on young leaves (Marquis and Braker 1994, Coley and Barone 1996). Therefore, leaf traits made on mature leaves may have little to do with the standing leaf damage since the damage occurred when the leaves were young and expanding.
Procedure
- Mark plants and the specific leaves for herbivory measurements. Leaves to be marked may be mature leaves, young leaves or a branch terminus prior to a leaf flush. Several methods to mark leaves are described below.
a) Place a colored telephone wire (see photo below) on the branch
- Establish a standardized way to orient the leaf pattern (i.e. always view the branch from terminus to branch base)
- Create a useful code to document the wire color and leaf of interest (i.e. R1 = first leaf after the red wire (for alternate leaves) or R1L = first leaf on the left after the red wire (for opposite leaves).
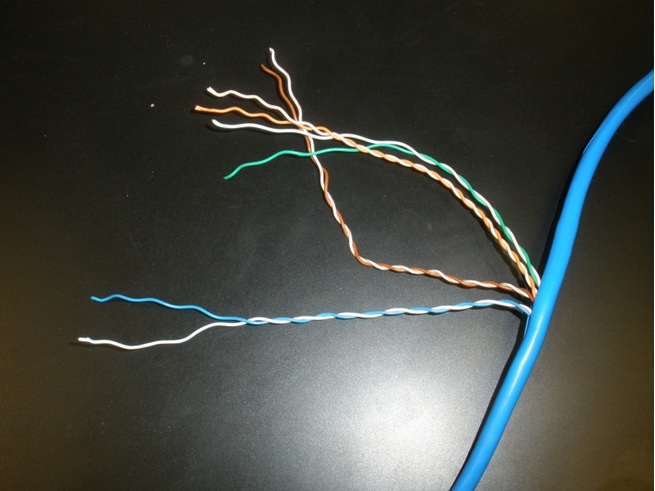
Telephone wire for marking leaves. This is 24 gauge 4 pair Cat. 5E. Cat 3, 5, and 6 work, but the key is that they are 24 gauge. Other wires tend not to twist as well when marking the leaves.
To Prep the Wires
-Cut the outer insulation
-Separate and untwist the pairs
-Cut individual wires to desired lengths for twisting around the plant stem
-In the image above, there are 4 pairs which give 8 different colors to identify with: blue, white w/ blue stripes, green, white w/green stripes, orange, white w/orange stripes, brown, white w/brown stripes
b) Note: Depending on plant morphology marking leaves may not be necessary. In these cases it is important to accurately record the onset of the leaf flush.
c) Place a small dot with a pen to indicate the leaf of interest.
- Record the leaves of interest
- Test the pen first to make sure a small mark will last. Some oil-based permanent paint pens work well.
d) Based on plant phenology marking leaves may not be necessary.
2. Record the date and any pre-existing herbivore damage (refer to measurement techniques below).
3. Revisit the leaves after the predetermined time interval(s) and record new herbivory damage (refer to measurement techniques below).
a) Measuring herbivore damage on recently expanded leaves will measure the total young leaf herbivory
b) When working with leaf flushes, record new leaf scars as they can be an indicator of 100% herbivory and total of new leaves produced. This is helpful when interpreting energy flows.
Herbivory measurements
1. Qualitative measurements
a) Visually estimate the percent herbivore damage and score it into predetermined categories. For example: 1 = 0 – 20%, 2 = 20 – 40% etc.
- Check accuracy with the grid or digital measurements
- Training and experience will increase the effectiveness
b) From these estimates, calculate an average score/leaf(plant)/time,
c) Translate them into an average percent damage (p) /time.
d) Calculate the average leaf area removed / time.
- Using the grid measurements, digital measurements or a leaf area meter calculate the average leaf area of the plant (LA)
- Leaf area removed/time = (LA*p)/ time
e) Pros
- This method takes very little time in the field and requires no processing back at the lab.
- Well suited for repeated field measurements
- The qualitative measurements have been found to be as effective as digital measurement when the number of categories for the extent of herbivory was four or less (personal comm R. Neisenbaum).
f) Cons
- Can be subjective
- Variability between observers can be problematic
- The more categories there are, the less accurate the estimations
- Can only detect large scale differences in herbivory
- Effectiveness decreases when making estimations on many different species with varying leaf areas and morphology
2. Grid measurements
a) Prior to heading out to the field or the greenhouse, make a clear grid and a contrasting solid back sheet (generally white is the best, but if you have very light green leaves you may want black background).
- Print graph paper that best suits your needs on a transparent film

- Graph paper with multi-weighted lines make field calculations easier.
- Laminate the transparent film and a solid piece of paper (or cardstock).
- Double or triple laminating the transparency will add stiffness and durability to the grid.
- The solid piece of paper is to add contrast and something to sandwich the leaf with. This can also be done with a clipboard or notebook. However, I have found the extra laminated paper to be easier to manipulate in the field.
b) Place the leaf of interest between the grid and the contrasting back sheet.
c) Record the number of squares covered by the leaf (l)
d) Record the number of squares that represent herbivore damage (d)
- To help calculate greater herbivore damage, try a dry-erase marker to sketch where the leaf would have been
e) Calculate the percent damage as [(d / (l+d) * 100)] / time
f) Calculate total damage as dx / time, where x is the area of the square
g) Pros
- Increased accuracy compared to visual estimations
- Can detect smaller differences in herbivory
h) Cons
- Takes considerably more time in the field
- Requires patience and consistency to make sure you are counting the squares with the same attention to details
3. Digital measurements
a) Prior to heading out to the field or the greenhouse, make a laminated sheet with a ruler and a cover sheet
- Print and laminate a piece of paper with a ruler for scale on it. For example: where each cm is marked
- An alternative method is to use a round sticker of known area (sticky dots, available at most newsagents or stationers).

- Find a thin piece of clear polycarbonate
- I found that a laminated transparency for the cover sheet can be too reflective when taking photos in the field
b) Take a picture of the plant tag, wire color or notebook to indicate which leaf is being photographed
- Take notes on the each photo taken, for example note whether the leaf is young, recently expanded or mature.
- alternatively use a piece of acetate and a dry erase marker to put a label in each picture
c) Place the leaf between the back sheet and clear cover sheet.
d) Take a picture of the leaf
- Be sure the ruler (or sticky dot) is in the field of view
- Position your fingers so it is out of the way of the leaf and scale
- Take the photo from as perpendicular position as possible.
- Take care, as best as possible, to avoid sun glare, your reflection, and shadows around the leaf.
e) Back at the lab label and organize the leaf photos
f) Analyze the leaves using Image J
- The overview of Image J procedures (see also Making wood anatomical measurements with imageJ and Measuring leaf perimeter and leaf area )
- Open image
- Set scale
- Draw a line on ruler> Analyze> Set Scale> enter known distance and make sure that Global is checked
- Grayscale
- Image> Type> 8bit
- Adjust image – Use eraser, paint brush, adjust contrast/brightness and threshold
- Adjusting and editing the image will take the most time in processing the photo. Once you get comfortable using the tools it will go quickly.
- Threshold
- Process> Binary> Threshold
- Select leaf area using wand
- Measure leaf area
- Analyze> Measure
- Record the leaf area (cm2) of the leaf area present (l).
- If there is herbivory in the middle of the leaf, highlight it separately and subtract that amount.
- Hint: Holding down shift lets you select more than one item at a time.
- If there is herbivory in the middle of the leaf, highlight it separately and subtract that amount.
- Reconstruct leaf and measure the estimated whole leaf area (LA).
- Use the drawing tool to draw the outside edge of where the leaf would have been
g) Calculate the percent damage as [ (l / LA)*100] / time
h) Calculate total damage as (LA – l)/ time, where x is the area of the square
i) Pros
- High accuracy
- Also with multiple species with different leaf areas and morphology
- Can detect smaller differences in herbivory
- Takes much less field time than grid measurements
j) Cons
- Requires computer time
- Depending on the number and types of leaves photographed this can be a quiet considerable amount of time
- With time and getting comfortable using Image J the photo processing can go quickly.
4. Other measurement options
a) Destructive methods
- Collect leaves from the field and run them through a leaf area meter back at the lab.
- Using paper and/or tape reconstruct the total leaf area
- One problem is that it requires that there was no herbivore damage prior to the observational time period.
- Using paper and/or tape reconstruct the total leaf area
- Or scan collected leaves for digital analysis (similar problem as above)
b) Trace and label the leaves on paper in the field
- Upon return visits place leaves back over tracing and shadow in missing leaf area
- Cut leaves out and run them through the leaf area meter as initial leaf area
- Cut out shaded areas and run them back through the leaf area meter
- Calculate the amount of herbivore damage as the initial from final leaf area
Example herbivory photos

Other resources
See also: Measuring area of colour patches (e.g. dead or damaged areas) on leaf surfaces,
Measuring leaf perimeter and leaf area
Links to resources and suppliers
LICOR https://www.licor.com/env/products/leaf_area/LI-3100C/
Free online graph paper generator http://incompetech.com/graphpaper/square.html
Image J https://imagej.nih.gov/ij/
Literature references
Coley PD (1983) Herbivory and Defensive Characteristics of Tree Species in a Lowland Tropical Forest. Ecol. Monogr. 53, 209-233.
Coley PD, Barone JA (1996) Herbivory and plant defenses in tropical forests. Annu. Rev. Ecol. Syst. 27, 305-55.
Marquis RJ, Braker HE (1994) Plant-herbivore interactions: Diverstiy, Specificity, and Impact. In: McDade LA, Bawa KS, Hespenheide HA Hartshorn GS (eds.), La Selva Ecology and Natural History of a Neotropical Rain Forest. The University of Chicago Press, pp. 261-81.