 Protocol
Author
Adrienne Nicotra
Overview
Here we describe how we used a Li-Cor 6400 in a glasshouse to measure temperature response of photosynthesis betwee ~8 and 48oC.
This protocol assumes as basic understanding of gas exchange. See Gas exchange protocol for LI-COR 6400 for an introduction.
Background
The thermal response of gas exchange varies between species and depending on growth conditions. Plants from hot dry climates generally reach maximal photosynthetic rates at higher temperatures than species from temperate climates.
Optimal temperatures for photosynthesis vary among species, with C3 plants generally having optima at temperatures between 20 and 30 oC (Larcher 1995), whereas arid, desert plants,C4 and CAM plants generally have higher optimal temperatures (30 to 40 oC, Larcher 1995) as well as broader temperature ranges at which gas exchange can be maintained at >90% of maximum rates (Berry and Björkman 1980; Downton et al. 1984).
Critical temperatures for thermal tolerance are often plastic within species (Froux et al. 2004, Nicotra et al 2008). Recent comparative studies show plasticity, but few consistent differences among species from different environments in thermal tolerance of photosynthesis (Knight and Ackerly 2002; 2003; but see Atkin et al. 2006 and Nicotra et al 2008).
The temperature above which photosystem II is damaged is usually > 45 oC (Sharkey 2005). This means that under most growing conditions, neither air temperatures nor average leaf temperature will exceed critical temperatures. However, if a plant is growing under conditions of water stress the stomata may close. In the absence of evaporative cooling, the leaves of plants in sunny arid environments may then reach critical temperatures.
Here we describe a method to measure temperature response of photosynthesis, focussing on carbon assimilation, not stomatal conductance measures, in a glasshouse. Further, we describe the curve-fitting approach we used to determine several critical points in the response curve: the optimal temperature for photosynthesis, the photosynthetic rate a optimal temperature, and the breadth of the temperature range at which photosynthetic rate was >90% of maximum.
Materials/Equipment
- Li-Cor 6400 with red blue light source running using a CO2 mixer
- Temperature controlled glasshouse
- Thermal heat gun
- Ice bucket and fan
Procedure
For basic operation of Li-Cor 6400 see Gas exchange protocol for LI-COR 6400
Measuring gas exchange
1. For our work we had access to two glasshouse chambers maintained at 7/17 oC and 17/27 oC night/day respectively.
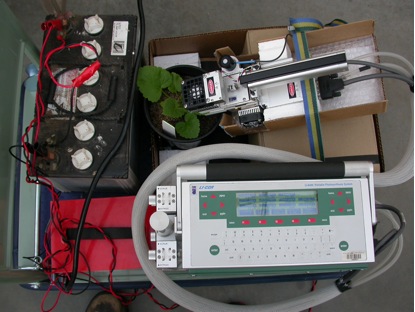
2. The LI6400 was placed on a trolley (see picture), with the sensor head mounted on a custom-made angled platform. This platform ensured that the sensor head was in the right position to clamp on to the leaf of an experimental plant, which was also on the trolley. We ran the LI6400 using a 12V truck battery which was also on the trolley. The ensured that the LI6400 and the plant were mobile between cold and hot glasshouses.
3. Trials were conducted throughout the morning. Experimental plants and the irga were first placed in the cooler glasshouse to acclimate for approximately one hour or so. Great care must be taken when working with the irga at low temperatures to avoid condensation in the machinery.
4. As it can be difficult to cool the LI6400 to a block temperature of 8oC (block T) we assisted cooling by placing the chamber it in front of a bucket of ice and a fan.
5. When the block had cooled to 8oC, the leaf was placed in the chamber for 10 minutes at experimental conditions (i.e. at a given light, CO2 and humidity level) to acclimate.
6. Logging commenced after the 10 minute period, with block temperature rising in 4oC increments after each stable reading was logged. We judged stability using the ‘totalCV’ option set at 0.5%.
7. After the 20oC reading had been logged, the trolley was moved to the warmer glasshouse chamber (17-270C) to assist the block heating process.
8. As we were measuring temperatures up to 48oC it was necessary to supplement block heating with a heat gun (1500W electric heat gun, RS, 616-009, see picture) directed at one of the outlet fans on the side of the sensor head. To do this the LI6400 and battery were taken off the trolley, polystyrene sheet baffles were placed in front of the sensor fans to prevent heat damage to the plant, and the heat gun was mounted on a stand at the same height as the outlet fans. The heat gun was switched on during heating and switched off once the set temperature had been reached. Extreme care must be taken not to heat the unit to higher temperatures. We recommend you check with Li-Cor (or your manufacturer) to determine what the heat limits of your unit are prior to applying this approach.
9. It is difficult to control VPDl (leaf to air vapour pressure difference) within a standard range when measuring over such a wide range of temperatures. In our work every effort was made to moderate VPDl, but as temperature increased, so did VPDl. Across all measurements average VPDl (∓SD) was 2.3∓1.6 KPa; at temperatures above 40 ∘C, average VPDl was 5.31∓1.52 KPa.
Curve fitting
1. The temperature response of photosynthesis was assessed by fitting curves to the photosynthetic data for each plant in SPlus using the following model:
Photosynthesis = (B – C*LeafTemp) exp(log(D)*LeafTemp)
2. The shapes of the fitted curves and fit of the data to the curves were good and were deemed appropriate for the data; individual r2 values exceeded 0.88 for all curves (median = 0.991). The parameters B, C and D were then recorded for each plant. These parameters do not directly describe plant traits, rather they were used to determine the biologically relevant parameters as described below.
3. The temperature at which photosynthesis reached its maximum rate (Topt) was determined by setting the derivative of equation (1) equal to zero;
Topt = B/C – 1/log(D) (2)
4. At Topt , the maximum rate of photosynthesis (Amax) is:
Amax = C/log(D)*exp[B/C*log(D) – 1] (3)
5. Topt and Amax were calculated for each plant.
6. We also calculated photosynthetic rates at the temperatures at which our plants were grown (18 oC and 28 oC) using (1).
7. The values of leaf temperature marking the endpoints of the range over which photosynthesis reaches 90% of its maximum value were numerically determined from the fitted curve for each plant. The difference between these values (90% Trange) was calculated as an indication of the breadth of the temperature range over which the highest rates of photosynthesis are maintained.
Literature references
This procedure was published in:
Nicotra AB, Cosgrove MJ, Cowling A, Schlichting CD, Jones CS (2008) Leaf shape linked to photosynthetic rates and temperature optima in South African Pelargonium species. Oecologia 154:625-635
See also:
Atkin OK, Loveys BR, Atkinson LJ, Pons TL (2006) Phenotypic plasticity and growth temperature: understanding interspecific variability. Journal of Experimental Botany 57:267-281
Berry J, Björkman O (1980) Photosynthetic response and adaptation to temperature in higher-plants. Annual Review of Plant Physiology and Plant Molecular Biology 31:491-543
Downton WJS, Berry JA, Seeman JR (1984) Tolerance of photosynthesis to high temperature in desert plants. Plant Physiology 74:786-790
Froux F, Ducrey M, Epron D, Dreyer E (2004) Seasonal variations and acclimation potential of the thermostability of photochemistry in four Mediterranean conifers. Annals of Forest Science 61:235-241
Knight CA, Ackerly DD (2002) An ecological and evolutionary analysis of photosynthetic thermotolerance using the temperature-dependent increase in fluorescence. Oecologia 130:505-514
Knight CA, Ackerly DD (2003) Evolution and plasticity of photosynthetic thermal tolerance, specific leaf area and leaf size: congeneric species from desert and coastal environments. New Phytologist 160:337-347
Larcher W (1995) Physiological Plant Ecology, 3rd edn. Springer, Berlin
Sharkey TD (2005) Effects of moderate heat stress on photosynthesis: importance of thylakoid reactions, rubisco deactivation, reactive oxygen species, and thermotolerance provided by isoprene. Plant Cell and Environment 28:269-277
Health, safety & hazardous waste disposal considerations
See Gas exchange protocol for LI-COR 6400
Take care when using heat gun not to damage equipment or burn experimenter.