 Protocol
Author
Ian Wallis
Overview
Near infrared reflectance spectroscopy (NIRS) is a technique for measuring the composition of a substance. This might include the sweetness of an uncut fruit or chemical makeup of a leaf. The use of NIRS started in agriculture in the 1970’s and has burst into almost every field of analysis imaginable. For example, manufacturers use NIRS to check the purity of aspirin in blister-packs. The incentive for using NIRS is that it allows the analysis of far more samples than would be possible with conventional chemistry. Moreover, it can predict functional attributes of a substance such as the amount of foliage a herbivore would eat (Wallis and Foley, 2003). A different use is to ask whether two sets of samples differ. For example, herbivores may attack certain trees and not others. Near infrared scans of the two sets of material may detect differences (e.g., by principal components analysis) that warrant further chemical analyses to identify the cause of the difference (Cunningham and Floyd, 2004). Another advantage of NIRS is that it is non-destructive – you can scan a sample and then use it for another purpose.
This article describes the concept of NIRS for those who are unfamiliar with the technique. It does not intend to describe the use of specific machines, the manipulation of data or the use of specific software packages.
Background
The basis of NIR spectrophotometry
Any material, for example plant tissues, comprises atoms connected by chemical bonds. Thus, chemical bonds describe the sample in much the same way that we can describe something by its shape, smell, taste and texture. Irradiating a sample of organic material, e.g. by shining light at it, causes the chemical bonds to vibrate which, in turn, causes stretching and bending of the bonds. This produces a wave motion within the bond at a frequency characteristic of the type of bond. The sample absorbs those frequencies of the incident light (that shone at the sample) that match the frequencies of the vibrational waves, but transmits or reflects other frequencies. This same process allows us to see coloured objects that intercept white light. For example, a red ball is absorbing particular red frequencies from the visible or white light that passes from the sun through the earth’s atmosphere.
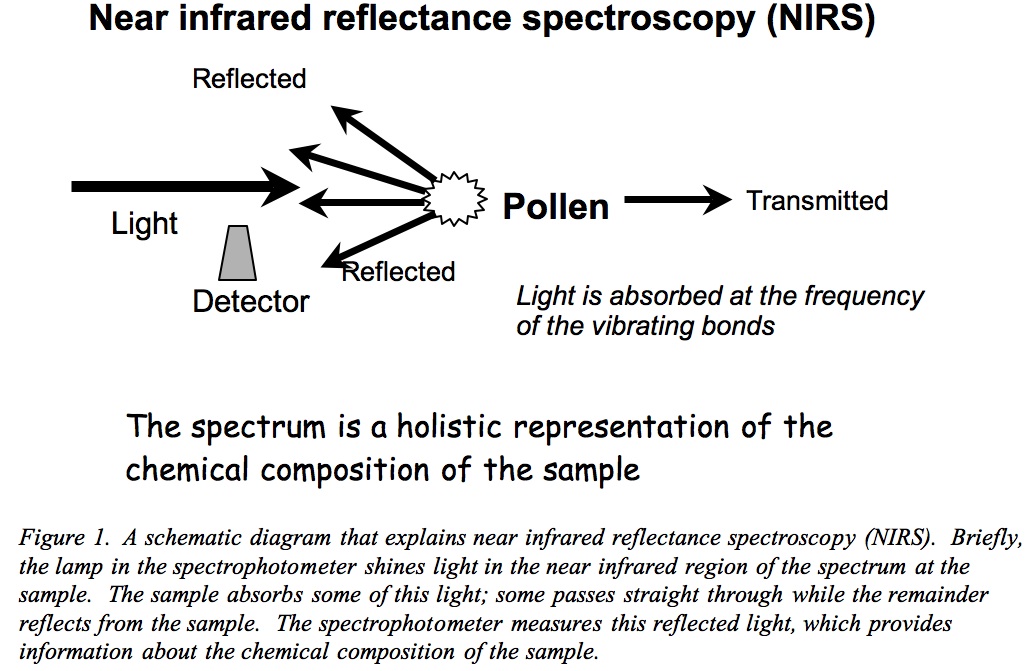
Fig 1: Schematic diagram explaining near infrared reflectance spectroscopy (NIRS).
It is mainly the carbon-hydrogen (C-H), nitrogen-hydrogen (N-H), carbon-oxygen (C=O) and oxygen-hydrogen (O-H) bonds that absorb near infrared radiation. These are the primary bonds of the organic constituents (e.g., carbohydrates, fat, protein) that build plant tissues. This answers another question – why do the spectrophotometers of interest use near infrared light It follows that the chemical composition of the tissues determines the types and numbers of the chemical bonds present and therefore the amount of light and the particular wavelengths absorbed. Likewise, the characteristics of the light reflected from the sample also contain information about its chemical composition. That said, the spectrum collected by the spectrophotometer from a sample of coal or a fresh, plump watermelon is a wiggly line from which we must extract the chemical information. This is because these samples are complex – they may contain hundreds of individual compounds that may each absorb light at many different wavelengths.
At this point, it is important to state that a NIR spectrophotometer is of almost no use without the support of a laboratory for measuring the component of interest. For example, if you wish to measure the protein content of thousands of seeds then a NIR spectrophotometer is a useful piece of equipment. But, this is true only if you have access to a laboratory that can measure the protein content of a portion of the seeds using chemical analysis. We refer to these portions as the calibration and validation sample sets.
Materials/Equipment
- NIR spectrophotometer e.g. NIR Systems Model 6500 Scanning Spectrophotometer fitted with a spinning cup module (FOSS, Silver Springs, Maryland, USA) or various instruments from Bruker.
- Software to manipulate spectral data e.g. WinISI II software (FOSS Analytical) or Bruker OPUS and many others.
Units, terms, definitions
NIR spectrophotometer: an apparatus for measuring the amount of light a sample absorbs at different wavelengths of the near infrared spectrum (800 nm – 2500 nm)
Sample set: the set of samples for which one obtains NIR spectra.
Calibration sample set: A set of samples selected statistically for chemical analysis. The selected samples cover the range of spectral variation in the entire sample set. Thus, the size of the spectral variation determines the number of samples in the calibration set.
Calibration equation: An equation that relates the spectra of the samples to their chemical composition (after validation = NIRS prediction model). Once validated, one uses it to predict the chemical composition of “unknown samples”.
Validation sample set: An independent set of samples chosen randomly from the original sample set and used to test the quality of the calibration equation. Thus, in a blind or double blind study one predicts their chemical composition using the calibration equation and compares this with their chemical composition determined with traditional analyses.
Procedure
Summarised procedure:
Let us imagine that our interest is in analysing the concentrations of protein, fat and amino acids (the building blocks of protein) in 300 samples of pollen from many different plants.
The first step is to set aside a portion of the 300 samples that we will use later to validate the NIRS procedure after initial calibration. This is the validation sample set and for this we might select 20 samples at random or perhaps from a wide range of the plant genera present.
The next step is to scan the remaining 280 samples with the NIRS to obtain their individual spectra. As with any population or group, most of the spectra will hover about some average. Others will progressively differ from this average until we get to the spectra that vary most from the average – the extreme spectra. These samples have high Mahalanobis’ distance (“H” values) and many people refer to them as outliers but they are extremely important in building a robust NIRS assay.
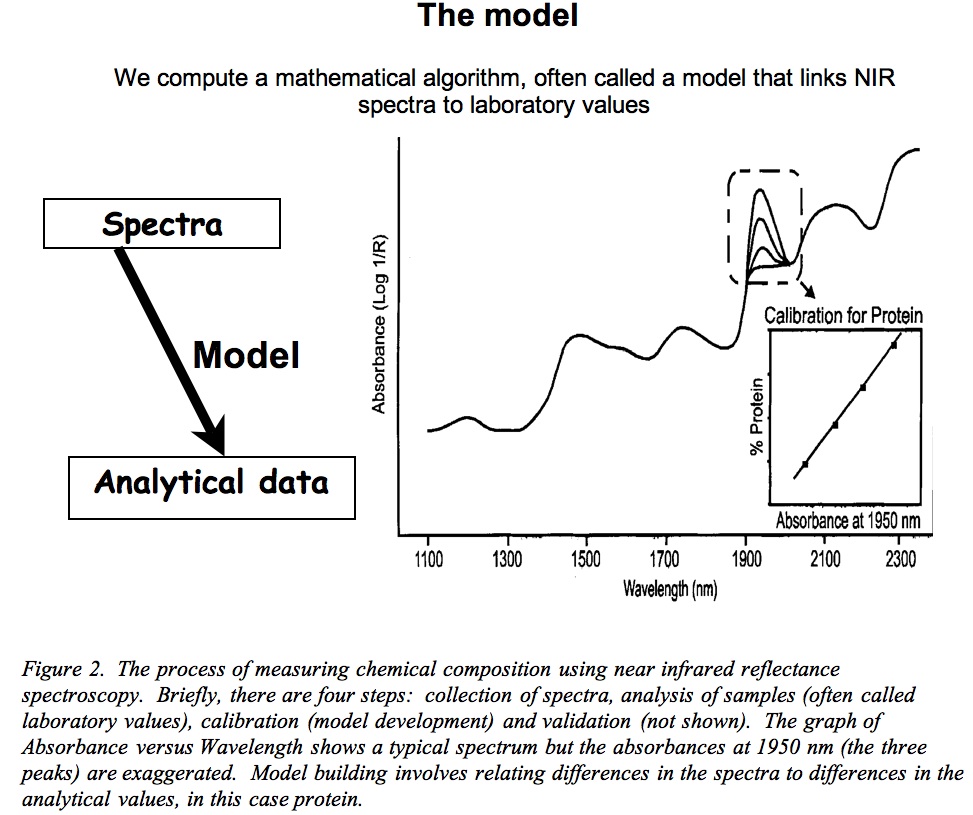
Fig.2: NIR model
After obtaining the spectra we are ready for calibration, whereby we select another portion of the samples, let’s say 60 samples (although we usually use a statistical approach here rather than an absolute number). This is where the computer is convenient because it ranks the spectra according to their “H” values and then selects a representative set to cover all the spectral variation. In other words, it selects many samples that have average spectra but it also selects samples whose spectra differ from the average. This set of samples is the “calibration set” and we analyse it by conventional chemical analyses, in this case for protein, fat and amino acids. One cannot overemphasise the importance of highly accurate analyses because the results have a large bearing on the quality of the product – the NIRS prediction model. As with any analysis, they need analysing in duplicate (two measures per sample) and if the two measures fail to closely agree then it is necessary to repeat the analysis.
With this done, we now have both spectra and chemical analyses for 60 samples and can direct the computer programme to build a calibration or prediction model. It does this using a technique known as regression analysis that relates the differences in the spectra to those in chemical composition. In our example, we will get 17 such calibration models – one each for protein, fat and the 15 individual amino acids that we typically measure. After completing the regression analysis, the statistical programme reports information that explains the quality of the calibration model. There are several statistics of particular interest. The first is the standard error of calibration (SEC) that we want to be as small as possible. The second statistic of interest is the coefficient of determination (r2) between the spectra and the analytical values (the r2 of calibration), whose values range from 0 to 1. A value of 1.0 indicates that all of the spectral differences between samples correspond perfectly with differences in analytical values. This is unusual but we often see r2 values of 0.95 to 0.99 – almost perfect. The third statistic of interest is the proportion of variation explained by cross validation (“1-VR” (variance ratio) or the coefficient of determination of cross validation). This we want close to 1 and similar to the r2 of calibration. Briefly, when building an equation the software uses a process of cross-validation whereby it sequentially removes groups of samples, makes a prediction equation with the remaining samples and predicts the composition of the omitted samples. This continues until the software has omitted all of the samples. Thus, 1-VR is the coefficient of determination (r2) between the laboratory values and the predictions made during cross validation. The fourth statistic is the standard error of cross validation (SECV) for which we want low values that are similar to the standard error of calibration. The final statistic of interest is the standardised SECV — the ratio of the standard deviation of the sample set to the SECV. If this value is greater than 3, the calibration is likely to give accurate predictions.
This stage, even obtaining a seemingly perfect calibration model, does not signal the end of the process. Instead, there is one more step: validation, using the validation samples that we set aside at the start. We collect the NIRS spectra of these 20 samples and then immediately analyse them. This done, we predict the chemical composition with the calibration models just developed. Thus, there are now two sets of values for each validation sample and for each analysis, namely the actual composition from the chemical analysis (a mean of two because we analyse samples in duplicate) and the predicted composition from the calibration model. Again, we return to regression analysis to compare the two and expect to see an almost perfect agreement between the two methods (Figure 3). Apart from having a high r2 value, the regression line should pass through the origin (i.e. if there is no nitrogen in a sample, then the calibration model predicts no nitrogen) and have a slope of 1.0 (samples with 1, 2 and 3% nitrogen are predicted to have about 1, 2 and 3% nitrogen). If so, we refer to the calibration equation as having no bias. Furthermore, we can incorporate the validation samples into the calibration.

Fig. 3:Validation of NIR values
If the validation succeeds, we no longer need to do chemical analyses and instead can simply scan the samples and predict their composition. In our example, we could scan a sample of pollen and immediately report its concentrations of protein, amino acids and fat. There is, however, a caveat to this statement about no longer needing chemical analysis: the calibration is suited only to sample types that it contains. Thus, in the case of pollen, one needs to ensure that any new species are spectrally similar to those in the model. In other words, a prediction equation needs constant validation and upgrading.
Notes and troubleshooting tips
- After developing calibration equations I would estimate the cost of NIRS analyses for bulk samples at $10 per sample. In other words, this requires someone to scan a sample, predict its composition and then prepare a report. Developing calibrations are far more expensive and depend on the type of sample preparation and the cost of the analyses. For example, in Australia in 2010 a nitrogen analysis on bulk samples costs roughly $20 per sample whereas finding someone to analyse a sample for amino acids is far more difficult and typical quotes are more than $150 per sample. The higher the cost of the chemical analysis, the greater the potential saving with NIRS.
- Many people in all types of industries use NIRS. Thus, there are some excellent fora on its use.
Literature references
Ecological application of NIRS:
Cunningham, S.A., Floyd, R.B., 2004. Leaf compositional differences predict variation in Hypsipyla robusta damage to Toona ciliata in field trials. Canadian Journal of Forest Research-Revue Canadienne De Recherche Forestiere 34: 642-648.
Foley WJ, McIlwee AP, Lawler IR, Aragones L, Woolnough AP and Berding N (1998). Ecological applications of near-infrared spectroscopy – a tool for rapid, cost-effective prediction of the composition of plant and animal tissues and aspects of animal performance. Oecologia 116: 293-305.
Wallis, I.R., Foley, W.J., 2003. Independent validation of near-infrared reflectance spectroscopy as an estimator of potential food intake of Eucalyptus foliage for folivorous marsupials. Aust. J. Zool. 51: 1-4.
Givens DI, De Boever JL and Deaville ER (1997). The principles, practices and some future applications of near-infrared spectroscopy for predicting the nutritive value of foods for animals and humans. Nutrition Research Reports 10: 83-114.
On statistical procedures associated with measuring chemical composition using NIRS:
Anon (1995). Standard practices for infrared multivariate quantitative analysis (designation E1655-94). American Society for Testing and Materials, Washington DC
Shenk JS and Westerhaus MO (1991a). Population structuring of near-infrared spectra and modified partial least-squares regression. Crop Science 31: 1548-1555.
Shenk JS and Westerhaus MO (1991b). New standardization and calibration procedures for NIRS analytical systems. Crop Science 31: 1694-1696.
Shenk JS and Westerhaus MO (1993). Analysis of agriculture and food products by near-infrared reflectance spectroscopy. Infrasoft International, Port Matilda.
Additional:
AOAC – Association of Official Agricultural Chemists (The AOAC publishes a journal on official methods of chemical analysis)
Health, safety & hazardous waste disposal considerations
There are no special safety concerns with NIRS. However, like many activities involving sample manipulation one should be aware of the dangers of dust.