 Protocol
Authors
Lawren Sack, Megan Bartlett, Chris Creese, Gaëlle Guyot, Christine Scoffoni
Author affiliations
University of California, Los Angeles
Overview
This is a detailed protocol for constructing and operating a pressure-drop hydraulics flow meter that can be used for stem hydraulics, as described here, and with minimal changes, can be used for leaf hydraulics (evaporative flux method, or rehydration methods). This is a relatively inexpensive, easily transportable and field deployable alternative to a 5-decimal analytical balance.

Figure 1.The complete hydraulics floweter. The raised graduated cylinder in the background contains flow solution, that runs via tubing through the flow meter (shown raised on a petri dish) to the fitting in the foreground which is to be connected to the sample to be measured for hydraulic conductance. The gray cables attached to the transducers on the flow meter run to the white data acquisition board on the right. The transducers are powered by the black battery/charger in the background. The data acquisition board is interfaced via USB cord to a computer (not shown).
Background
The concepts and theory that form the background and other essential information is to be found in the paper,
Melcher PJ, Holbrook NM, Burns MJ, Zwieniecki MA, Cobb AR, Brodribb TJ, Choat B, Sack L. Measurement of stem xylem hydraulic conductivity: field instrumentation and implementation, to be submitted.
The authors of that paper were those who designed the original version of this flow meter, which has been refined and improved since then to the version described in this protocol.
Materials/Equipment
(supplier / part name / part number)
Note: there are many possible alternatives, and periodically, parts may become discontinued and exact replacements may or may not be available. The list below is what was available and excellent at time of initiating this protocol. We hope that additional alternatives will be added by other contributors over time.
Flow meter parts and accessories
- Plastic 50 mL graduated cylinder (Fisher/Thermo Scientific Nalgene Polypropylene Cylinder 50mL/ 08-572C)
- Luer 5-port manifold (Cole Parmer/ Polycarbonate manifold, 5 ports, pkg 10/ K-30600-43)
- Luer 1-way stopcocks, at least 5 (Cole Parmer/Male lock 1-way polycarbonate stopcocks, pkg 10/K-30600-00)
- Luer 4-way stopcocks, at least 5 (Cole Parmer/Male lock 4-way polycarbonate stopcocks, pkg 10/K-30600-04)
- Tubing:
- PEEK resistance tubing, 1/16″ OD
- Red 0.005″ ID (VWR/ 5′ red PEEK tubing / 21511-392)
- Yellow 0.007″ ID (VWR/ 5′ yellow PEEK tubing / 21511-394)
- Blue 0.010″ ID (VWR/ 5′ blue PEEK tubing / 21511-382)
- Orange 0.020″ ID (VWR/ 5′ orange PEEK tubing / 53500-690)
- Green 0.030″ ID (VWR/ 5′ green PEEK tubing / 21511-388)
- To connect cylinder to manifold (Cole Parmer/Tubing, nylon, ID 0.080 OD 1/8″, 100 feet pack/ C-95880-04)
- To connect sample tubing to manifold (Cole Parmer/ PVC tubing with luer ends M/M, 24″, pkg 20 / K-30600-67)
- To connect transducers to system (Cole Parmer / Tygon lab tubing, 1/8″ID x 1/4″OD, 50 ft pack/ 06408-47)
- To connect PEEK tubing to system (Cole Parmer/ Silicone (platinum-cured) tubing, ID 1/32″ OD 3/32″ = ID 0.031″ OD 0.094″ wall 0.0315″, 25 ft pack/ EW-95802-01)
- To connect sample (some example sizes):
- Very small (Cole Parmer/ Silicone tubing, ID 1/32″ OD 3/32″ = ID 0.031″ OD 0.094″ wall 0.0315″, 25 ft pack/ EW-95802-01)
- Small 1 (Cole Parmer/ Silicone tubing, ID1/16″ OD1/8″ = ID 0.063″ OD 0.125″ wall 0.031″, 25 ft pack/ EW-95802-02)
- Small 2 (Cole Parmer/ Tygon Lab Tubing ID 1/16″ OD 1/8″ wall 1/32″= ID 1.6mm OD3.2mm wall 0.8mm/ C06408-62)
- Small 3 (Cole Parmer/ Tygon Lab Tubing ID 3/32″ OD 5/32″ wall 1/32″ = ID2.4mm OD4mm wall0.8mm/ C-06408-63)
- Medium 1 (Cole Parmer / Tygon lab tubing, 1/8″ID x 1/4″OD, 50 ft pack/ 06408-47)
- Medium 2 (Cole Parmer / Silicone tubing, ID 1/8″ OD 1/4″OD = ID 0.125″ OD 0.250″ wall 0.0625″, 25 ft/pack/ EW-95802-05)
- Medium 3 (Cole Parmer / Tygon Lab Tubing ID 3/16″ OD ¼” wall 1/32″ = ID4.8mm OD6.4mm wall0.8mm /C- 06408-66)
- Medium 4 (Cole Parmer/ Tygon Lab Tubing ID 5/32″ OD 7/32″ wall 1/32″ = ID4mm OD5.6mm wall0.8mm/ C-06408-65)
- Large 1 (Cole Parmer / TYGON LAB TUBING, 1/4″ID X 5/16″OD, 50 FT/PACK/ 06408-49)
- Large 2 (Cole Parmer / Silicone tubing, ID 0.250″ OD 0.438″ wall 0.094″ = 1/4″ID x 7/16″OD, 25 ft/pack/ EW-95802-13)
- Large 3 (Cole Parmer / Bev-A-Line IV Tubing ID ¼” OD 3/8″ wall 1/16″ = ID6.4mm OD9.6mm wall1.6mm / C-06490-15)
- PEEK resistance tubing, 1/16″ OD
- Luer fittings to connect tubing:
- To connect transducer tubing to system (Cole Parmer/Luer Male 1/8″ barb, pkg 10/ 45510-52)
- To connect PEEK tubing to silicone tubing (Cole Parmer; Male luer barb adapter, PVC, 3/32″, pack of 10/ EW-45510-51)
- To connect system to tubing running to graduated cylinder (Cole Parmer / Female luer barb adapter, PVC, 1/16″, pack of 10/ 45510-00)
- Female luer barb adapters to connect sample tubing to system (to fit the tubing sizes listed above)
- Cole Parmer/ Female luer barb adapter, PVC, 3/16″, pack of 10/ EW-45510-04
- Cole Parmer/ Female luer barb adapter, PVC, 1/16″, pack of 10/ EW-45510-00
- Cole Parmer/ Female luer barb adapter, PVC, 1/4″, pack of 10/ EW-EW-45510-05
- Cole Parmer/ Female luer barb adapter, PVC, 5/32″, pack of 10/ EW-45510-03
- Cole Parmer/ Female luer barb adapter, PVC, 1/8″, pack of 10/ EW-45510-02
- Cole Parmer/ Female luer barb adapter, PVC, 3/32″, pack of 10/ EW-45510-01
- Large syringes with luer-lock tip (Cole Parmer/60 mL B-D plastic disposable syringe, luer-lock tip, 40 per box/EW-07940-30 )
- Small syringes with luer-lock tip (Cole Parmer/B-D™Disposable Syringes, Luer-Lock Tips, 10 mL box of 100/EW-07940-12 )
- Short syringe needles (Cole Parmer / B-D™Needles, 1″L, 1.24 mm OD box of 100/ EW-07940-68)
- Long syringe needles (Cole Parmer / B-D™Needles, 1″L, 0.71 mm OD box of 100/ EW-07940-58)
Support:
- Lab stand (VWR/ steel support rectangular base, 6 x 11 inches / 60110-266)
- Two or three prong extension clamp, and clamp holder, to hold graduated cylinder to lab stand rod
Computer interface:
- Data acquisition board and software (National Instruments/ USB-6009 Kit – USB-6009 and LabVIEW Student Edition/779321-22)
- Laptop
- Power supply with rechargeable battery and wall adaptor (Campbell Scientific (via Western Weather Group)/ PS100 PTO 12V POWER SUPPLY W/CHARGING REGULATOR & 7AHR + SEALED RECHARGEABLE BATTERY + POWER WALL ADAPTER AC/AC 110VAC TO 18VAC 1.2A, 6FT CABLE)
For preparing degassed flow solution:
- Vacuum flask (Fisher/ Pyrex Filtering Flasks with Tubulation 2000 mL/ 5340-2L)
- Rubber stopper (Fisher / Fisherbrand Solid RubberStoppers> Size No. 9/ 14-130N) with 1/4″ hole drilled
- Vacuum pump and vacuum tubing
- Tubing to remove solution from vacuum flask (Cole-Parmer/ Bev-A-Line®IV tubing, 1/8″ID x 1/4″OD, 50 ft pack/ C-06490-12)
- Stopcock to connect tubing to syringe (Cole Parmer/Male lock 4-way polycarbonate stopcocks, pkg 10/K-30600-04)
- Fitting to connect tubing to stopcock (Cole Parmer/ Female luer barb adapter, PVC, 1/4″, pack of 10/ EW-EW-45510-05)
- Magnetic stirring plate and stir bar
- KCl
- Syringe filters (Cole Parmer / Regenerated Cellulose Sterile Filters; pore size; 0.22μ; Acrylic, Housing; box 50 / EW-02915-52)
- Tubing to re-filter solution (Cole Parmer / Tygon lab tubing, 1/8″ID x 1/4″OD, 50 ft pack/ 06408-47)
- Stopcock to connect re-filtering tubing to syringe (Cole Parmer/Male lock 4-way polycarbonate stopcocks, pkg 10/K-30600-04)
- Fittings to connect re-filtering tubing to stopcock and to syringe, 2 (Cole Parmer/ Female luer barb adapter, PVC, 1/4″, pack of 10/ EW-EW-45510-05)
Transducers and electronics
- Pressure transducers, two plus spares (Omega, Gage model with a range from 0 to 5 psig/ PX26-005GV)
- Connector for transducer (Omega/ 4-pin connector /CX136-4 Omega)
- Wire to connect transducers, battery and DAQ board (Omega, 4 conductor copper wire, 100 ft, TX4-100)
- Sealable bag to cover electronic board (Fisher / 2 oz. Whirl-Pak Bags / 01-812-6A)
- For voltage regulator parts and design, see attached, “Voltage Regulator Circuit 9V” by John Milligan, UCLA
Tools and supplies
- Soldering iron and solder (e.g. Rosin Core 40/Tin 60/Lead)
- 2 mm flat head screw driver
- Needle nose pliers
- Multimeter (e.g. Omega/ Auto-Ranging Multimeter/Thermometer/ HHM16)
- Razor blades
- Electrical tape
- Digital thermometer (ColeParmer/ Cole-Parmer Type-K Thermocouple Thermometer with Offset/ K-91210-31)
- Parafilm
- Lab tape
- Zip ties, i.e., cable ties (Cole Parmer/ Solid-design 4″L cable tie, white, bag of 1000, EW-06830-52)
- Measuring tape
- Wire strippers/ cutters

Figure 2. Clockwise from left, a 60 mL syringe, a 5-port manifold, tubing with luer ends, razor blade, small nylon tubing, male luer fitting for attaching tubing and four-way luer lock stopcock.
Units, terms, definitions
Tr0 and Tr1. Pressure transducers at positions 0 and 1, which give the pressures before the high-resistance tubing (P0), and after the high resistance tubing (P1, i.e., before the sample), respectively.
PEEK tubing: made ofPolyether ether ketone,used to impose a high hydraulic resistance in the flow meter to resolve a pressure drop within the system with the transducers; available with different internal diameters and thus resistances, color coded by internal diameter.
DAQ: Data acquisition board interfaces pressure transducer output with computer via USB.
Procedure
I. PREPARING THE FLOW METER-FLOW SYSTEM
1. Connect graduated cylinder to lab stand to enable different cylinder heights to generate various pressure drops. Insert nylon tubing (ID 0.080 OD 1/8″) into graduated cylinder, so that the tubing reaches to near the bottom, seal the tubing into the graduated cylinder with parafilm and connect other end of tube using fitting (Female luer barb adapter, 1/16″) to a luer 4-way stopcock, and that stopcock to the upstream end of the manifold.
2. Connect the two syringes: one to the 4-way stopcock upstream, and the other to manifold stopcock 5 (see Fig. 3).
.")
Figure 3. The hydraulics flow meter manifold when completely assembled. Manifold stopcocks 1-5 and the upstream 4-way stopcock control the flow. Syringes at either end can be used to move solution, especially useful when filling the system and removing bubbles. The blue high-resistance PEEK tubing connected to outflows 2 and 3 generate a pressure difference between the two transducers (Tr0 and Tr1).

Figure 4. The tubing leaving the elevated graduated cylinder runs to the 4-way stopcock upstream of the manifold, delivering the water under pressure that flows through the flow meter and sample. The labeling on the lab stand and graduated cylinder is to help calibrate the transducers (discussed in Section VI “Calibrating the transducers“, below).
3. Preparing the resistance tubing. The right PEEK resistance tubing has to be selected according to how resistant your sample is to water flow. See Section V, “Determining resistance of PEEK tubing and selecting the right tubing“ to determine the best resistor for your sample. It is recommended to have at least three types ready and measured for their resistance before you start with a species in case you need to change PEEK tubing for different samples.
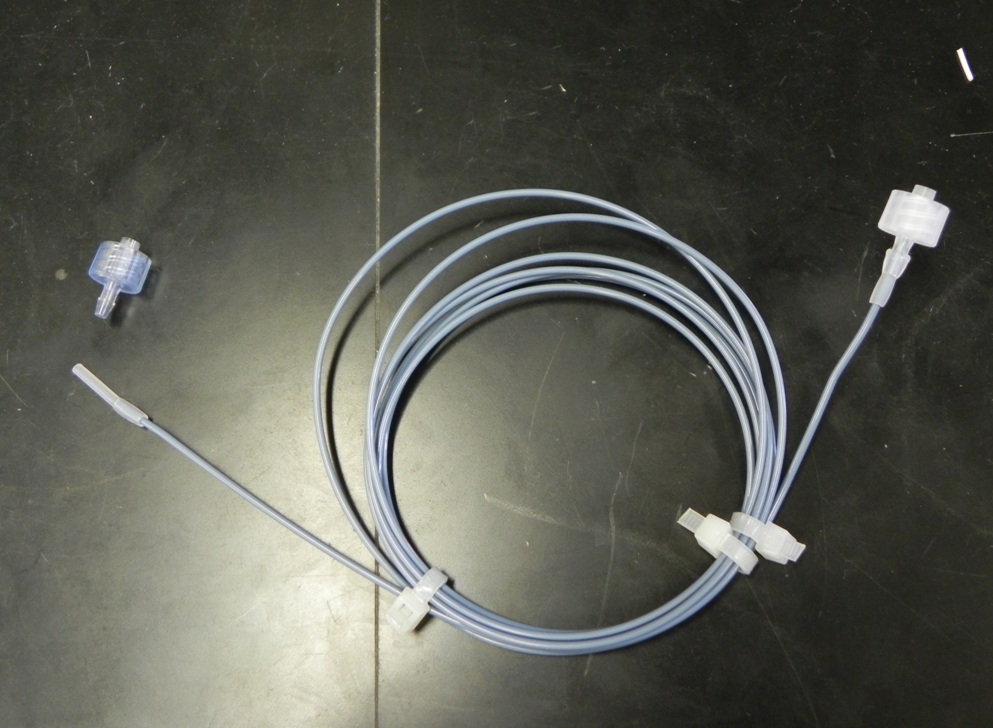
Figure 5. The blue PEEK resistance tubing, with male luer fittings attached on either end via small silicone tubing. The PEEK tubing is coiled and secured with zipties.
4. Connect PEEK tubing of known resistance to the flow meter manifold, connect the two ends of the PEEK tubing to fittings (Male luer barb adapter, 3/32″) using silicone tubing (ID 1/32″ OD 3/32″ = ID 0.031″ OD 0.094″ wall 0.0315″).
5. Prepare small pieces of tubing with fittings to connect samples downstream of the flow meter. Make these using tubing of various sizes that will match your samples, and connect 4 cm pieces to the female luer fittings with the appropriate barb size.
Before filling the flow meter please read Section III, “CLEANING THE FLOW METER” and Section IV, “PREPARING FLOW SOLUTION AND FILLING FLOWMETER” below.
II. PREPARING THE FLOW METER-TRANSDUCERS
1. Transducers require a voltage input and translate pressure into voltage (mV) output. A field portable 12 V battery, or a plug-in voltage supply can be used to supply voltage for pressure transducers to run one or several flow meters. The transducers output to a data acquisition board (DAQ) interfaced by USB to a computer (we use a laptop for field portability). The voltage supplied should be that specified by your transducer (e.g. PX26 provides a mV output proportional to input up to 10 V). The stability of the transducer output will depend partially on the stability of the voltage supply. We advise using a voltage regulator circuit between battery and transducer to provide stable voltage (see additional attached file, “Voltage Regulator Circuit 9V” for an example).
2. Cut ~1-2 cm of tubing (Tygon tubing, 1/8″ID 1/4″OD) and insert the barb of the transducer. Insert the barb of a luer fitting (Male 1/8″ barb) to the other end (to attach to manifold), and tighten around the tubing with zipties to seal tightly against the barbs on both ends.

Figure 6. Connecting the fitting to the transducer.
3. Cut ~1 m length of 4 conductor copper wire for each transducer. Use a wire-stripper to cut away the outer plastic and expose ~1-2 cm length of insulated wires on either side.
4. For both ends of 4 conductor copper wire, remove the sheathing material (cotton and wire mesh) from around the insulating wires with wire cutters to expose the insulated copper wires (red, green, black and white insulated wires). Use wire-stripper to strip insulation off red, green, black and white wires to expose ~4 mm of length. Too much exposed length may lead to fraying and bad contacts, but too little length may be insufficient to connect to the transducer on one end and the data acquisition board on the other.
5. Gently twirl loose wire ends together for each wire. Push wires into clamps on the transducer 4-pin connector. Keep track of which color wire enters which slot (numbered 1-4) to maintain consistency with the battery and DAQ. The voltage supply wire should be placed in the first slot, which corresponds to the notched pin. For example, we chose red as the voltage supply wire to enter slot 1, followed by green, black and white. Carefully solder each wire to the clamps to make connections more robust (Fig. 7). While the 4-pin connector specs state that soldering is unnecessary, we have found soldering essential for reliable contact.

Figure 7. Wires connected to the 4-pin connector into which the transducer will be inserted. Note the soldering of the wires to the connector.
6. Check contacts. We use a multi-meter on the beep connectivity setting with the black lead touching the free end of given wire, and the red lead touching the slots into which the transducer pins will be inserted. A beep should sound only when you are touching the slot corresponding to the wire of a given color. No beep indicates a lack of contact and the wire position has to be adjusted to make a connection. If a beep sounds when touching a wire and a non-corresponding slot, wire contacts may have been mistakenly soldered together and need to be separated.
7. Insert the transducer pins into the 4-pin connector, careful to place the notched pin into slot 1 of the 4-pin connector to receive the voltage supply (e.g. red wire).

Figure 8 . Transducer with tubing and fitting inserted into the 4-pin connector with soldered wires.
8. Tape around the connector and transducer contacts with black electrical tape to waterproof.
9. When two transducers are prepared as above, they can be connected to the data acquisition board. Connect transducer cables to the analog side of the DAQ board. Skip ground ports on the DAQ and align transducer wires according to the original arrangement with pin connector, connecting the positive wire upstream of the negative. For example, green first, then white.


Figure 9. Cables from the two transducers connected to the DAQ board. Note the green and white wires were used from each cable, and the red and black wires that will supply voltage to the transducers are still free.
10. Connect DAQ board to computer. The DAQ board translates the DC mV signal from the transducers into a digital binary output read by the LabView software which will provide the data.
11. Voltage regulator board. For the voltage, we recommend a voltage regulator circuit board (see attached diagram, “Voltage Regulator Circuit 9V”, by John Milligan, UCLA). The boards we use have red and black wires to connect to the transducer, and yellow and black to run to the battery terminals. Protect circuit board in plastic bag or container.

Figure 10. Voltage regulator circuit, with yellow and black wires to run to battery, and red and black wires to run to the transducers. Circuit board can be protected in a small sealable Whirlpak bag.
12. Connect transducers to voltage. Gently twirl Tr0 and Tr1 black transducer wires together with the black wire from the circuit board and wrap with electrical tape. Likewise connect Tr0 and Tr1 red transducer wires together with the red wire from the circuit board and wrap with electrical tape. This will protect the wires from water splashes and prevent a short from the positive and negative wires touching.

Figure 11. Connection of wire from voltage regulator (thick red wire at top) to the wires supplying voltage to the transducers (thinner red wires). The three wires are twirled together and taped with electrical tape. The black ground wires from the transducers are also twined together and taped (pointing forward), with the thick black wire running to the battery still to be twined (top right).
13. Connect circuit board to battery. Yellow wire from circuit board enters positive battery port; black wire from circuit board enters ground port. Turn on battery and transducers should be active.
14. Read the transducers with a laptop running LabView. Install LabView and open LabView virtual instrument for Kstem measurement, “Kstem.vi”. Configure the program to read your transducers.
15. Test and troubleshoot the transducer / computer interface. To test that the transducer is receiving voltage and giving output, connect air-filled syringe to the transducer luer fitting (via a 4-way stopcock) and very gently pressurize (do not rupture diaphragm!) and watch for response in Tr0 or Tr1 panel in LabView. This will also allow you to test whether the transducers are being read into LabView as Tr0 or Tr1 based the DAQ configuration.
If there is no response, test the following:
- Battery voltage output: use multimeter and touch black and red leads to battery terminals (black to ground, red to positive). If you read 12 V then the battery is supplying voltage, move onto step 2. If not, then check your battery is charged!
- Transducer voltage input: peel back electrical tape on the cable connecting the black and red transducer wires. Touch black lead to black transducer wires, red lead to red wires. If reading voltage regulator output (9 V) then the circuit board is supplying voltage.
- Transducer millivolt output: Touch multimeter red and black leads to the green and white transducer wires connected to the DAQ. Change multimeter setting to 200 mV and gently apply air pressure with syringe to the transducers and check for response. If there is no response, disconnect and reconnect green and white wires to DAQ board to ensure contact and retest. If the problem continues, the connection of voltage to the transducers might have failed, and need resoldering, or the transducer may be broken and need replacement. If there is a response, the transducer is working and the software is just not reading the signal. To test device response, in LabView go to TEST PANELS > START and gently push syringe filled with air and watch for a response. If both transducers show a response, then there is a LabView software issue. Contact National Instruments for further assistance as needed.
III. CLEANING THE FLOW METER

Figure 12. All non-electric flow meter components disassembled and ready to be bleached. Of course the transducers and electronics are far away! We suggest bleaching everything that will be used, including the graduated cylinder, extra beakers for solution, petri dish for cutting plant material, all the pieces of tubing with fittings that will be used for samples. Note and identify the large gymnosperm cone.
It is important to bleach and rinse the flow meter before making measurements and to repeat at least once per week to keep the system free of microbes and particulates.
We recommend soaking all non-electronic components of the flow meter and accessories (including manifold, tubing, fittings, graduated cylinder, vacuum flask and stir bars to be used for degassing water, etc.) in 10% bleach solution for at least 20 minutes. This should be followed by rinsing with DI water at least five times and again with ultrapure water (Millipore) three times to ensure no traces of bleach remain – this would damage the transducers and plant tissue.
1. Bleach should be pushed through all tubing, using a syringe connecting to the luer fittings.
2. After bleaching, flush tubing, including the high resistance PEEK tubing. A pressure-delivery system is helpful. For instance, a syringe with filtered water can be mounted in a caulking gun to apply pressure. Be sure to flush out all the volume of the inside of the tubing with each flush.

Figure 13. Flushing bleach out of PEEK tubing using a syringe. Watch for many droplets to come out as you flush out all the bleach!
3. Keep all parts sterile until ready for measurements by covering the ports of fittings and manifold, ends of tubing, graduated cylinders, flasks, etc. with parafilm.
IV. PREPARING FLOW SOLUTION AND FILLING FLOW METER
1. Degas Millipore ultrapure water using vacuum pump and magnetic stir bar on stir plate (at least 8 hours). Degassed water in a well-sealed container lasts ~24 hours. You can add 10 mmol/L KCl to water before degassing for stem hydraulic measurements to maximize ion-responsive flow.
2. Moving (partially) degassed solution from flask to system without re-gassing. We have a 2 L vacuum flask and use a No. 9 rubber stopper with ID 1/8″ OD 1/4″ Bev-a-line tubing running through it, and coiled at the base of the flask. The end of the Bev-a-line tubing protruding from the rubber stopper is connected via a fitting (Female luer barb adapter, 1/4″) to a luer 4-way stopcock. This system allows a syringe to be used to withdraw solution from the bottom of the flask after degassing. We degas the water by running vacuum tubing from the vacuum flask to the vacuum pump, with a stir bar in the bottom of the flask, and the flask on a stir plate to facilitate bubble formation. When the solution is degassed, turn off the vacuum pump, and release the vacuum from the flask by slightly opening the rubber stopper. Then, replace the stopper, and you can withdraw degassed water from the bottom of the flask from the protruding tubing. The water should stay partially degassed near the bottom of the tube, as air takes a long time to diffuse through water to the bottom of the flask.
3. Re-filtering the degassed solution. For rigorous cleanliness, we suggest re–filtering the degassed ultrapure flow solution. Attach 4-way stopcocks via fittings (Female luer barb adapter, 1/4″) to the ends of a 20 cm piece of tubing (Tygon lab tubing, 1/8″ID x 1/4″OD)that was previously bleached, and connect a 0.20 μm syringe filter and syringe to one end and a syringe to the other (this will be Syringe 1 for your flow meter). Remove the syringe from the syringe filter and draw up degassed solution from the vacuum flask tubing then squeeze any air from the spout of the syringe and reconnect the syringe to the syringe filter. This will be the syringe used to withdraw degassed solution from the flask. (Note that directly withdrawing solution from the flask through a syringe filter into a syringe is not effective; this will draw bubbles out of the filter into the solution and if the filter is air-filled, it will not be possible at all).
4. Fill up the flask syringe with the degassed filtered Millipore water. Push the syringe plunger down to push solution through the filter and through the tubing into the second syringe.

Figure 14. Re-filtering the degassed ultrapure flow solution, by pushing from one syringe to another through a syringe filter. Note that the solution has already all been pushed from the first syringe to the second, which will be used to fill the flow meter system.
5. Attach syringe 1 with degassed solution to the 4-way stopcock upstream of the manifold. Attach another syringe (syringe 2) with degassed solution to stopcock 5 of manifold. Both syringes can be used to fill and flush the flow meter system and to rid the system of bubbles. In particular, syringe 1 can be used to initially fill the graduated cylinder and the manifold system while syringe 2 can especially be used to flush downstreaam sample tubing when connecting plant samples to the flow meter.
6. Using syringe 1, fill the graduated cylinder with degassed solution by opening the 4-way stopcock connected to the tubing running into the cylinder, and closing it to the manifold. Once the graduated cylinder is filled with water and bubble-free, and tubing is bubble-free, turn the 4-way stopcock so that syringe 1 is now open to the manifold. Close all other stopcocks except open stopcock 5, and fill the system, making sure no air bubbles remain. Close stopcock 5 so that water is not lost from manifold.
7. Connect the transducers to the manifold. Use a syringe with needle to fill transducers with degassed solution (careful not to penetrate transducer diaphragm!) and remove any air bubbles. To attach the transducer to manifold, open stopcock 1 and use syringe 1 to push out a water drop so when attaching Tr0 transducer, water menisci meet and no air bubbles enter the system. Careful not to apply too much pressure with syringe 1, this could damage your transducer. Do the same for Tr1 in stopcock 4. To ensure that transducers are free of air bubbles, gently pull syringe back to create a small tension so any air bubbles will expand into view. Be very careful to not rupture diaphragm by pulling too hard. Close stopcocks 1 and 4 to bypass transducers until needed.

Figure 15. Filling the transducer with solution before connecting to the flow meter.
8. Connect PEEK tubing to the manifold. Flush and fill PEEK tubing connected to the fittings with degassed filtered solution to get rid of any air bubbles. Ensure fittings at the ends of PEEK tube have emerging water droplets for attachment to manifold. To attach PEEK to manifold open manifold stopcock to allow droplet of water to emerge so when connecting PEEK, water menisci touch and no air bubbles enter system. Close stopcocks to bypass PEEK tubing until needed.

Figure 16. Connecting PEEK tubing (resistance tubing) to the manifold.
V. DETERMINING RESISTANCE OF PEEK TUBING, TEMPERATURE CORRECTION, AND SELECTING THE RIGHT TUBING
1. Determining the resistance of PEEK tubing.While some have estimated the resistance of PEEK tubing using the Hagen-Poiseuille equation, based on the internal diameter, the deviation of internal diameter from its specs can result in substantial error. Rather, the resistance of the tubing segment should be determined using flow to a balance, or a pipette:
2. Connect the sample tubing at bottom of flow meter into a graduated pipette. Open up the stopcocks on the manifold to allow a pathway from graduated cylinder through the PEEK tubing, but shut the stopcocks to bypass the transducers. Water should flow from the cylinder through the PEEK tubing out through the pipette. The resistance of the PEEK tubing can be determined as the pressure driving force corresponding to the height of the meniscus of solution in the cylinder above the pipette (where 10 m of height corresponds to 0.1 MPa of pressure) divided by the flow rate (made by repeated measurements of movement of the meniscus in the pipette). Alternatively, to determine the flow rate, rather than a pipette, the outflow tubing can run to a cylinder of water on a 5-decimal balance logging mass to a computer.
3. Temperature correction: The temperature of the solution should be taken at time of calibration, to allow correction for viscosity effects. Given the temperature of the solution is > 20oC, you can correct the resistance of the tubing to 25oC, by multiplying by

4. Choosing the best resistor for your sample.The flow meter provides the best readings when the resistance of the PEEK and sample are approximately equal (see Melcher et al., to be submitted). This is because
 ,
,
and the difference between P1and P0will depend on the relative resistances of PEEK tubing and sample.
- If the PEEK resistance is too low, most of the pressure drop will occur across the sample, and P1will be too close to P0. The difference will be too small to resolve and noise will dominate. You will see an unstable flow rate and conductance measurement.
- If the PEEK resistance is too high, most of the pressure drop will occur across the PEEK tubing, and P1will be close to zero. You will see an unstable flow rate and conductance measurement.
- Ideally, P1should be approximately 50% of P0 to balance the pressure drop and get the best signal to noise ratio.
- Red PEEK has the highest resistance and is a good first choice for leaves. Yellow PEEK can be used for more conductive leaves or less conductive stems. Blue PEEK has ¼ the resistance of yellow and is a good option for stems. Of course different lengths of PEEK tubing can also be selected to achieve different resistances.
VI. CALIBRATING THE TRANSDUCERS
(Use “Calibration” sheet in the Kstem_measurement.xls spreadsheet workbook, attached at base of protocol)
To accurately translate voltage into pressure, calibration of your transducers needs to be done every day before the start of a series of measurements. Calibration is quick, taking an expert no more than 5 minutes, and thus can even be repeated between measured samples.
1. Set up your manifold so that stopcocks 1 and 4 are open to transducers, but stopcocks 2 and 3 are closed to the PEEK tubing. Make sure stopcock 4 is off towards the sample side so water does not flow through, but rather the pressure delivered from the head at the graduated cylinder equilibrates with the transducers as indicated in blue below.

Figure 17. Transducer calibration. Note the configuration of the stopcocks on the manifold, so that both transducers are equilibrated with the pressure delivered from the head generated by graduated cylinder upstream (not pictured).
2. Place strip of lab tape along the length of the lab stand. Adjust height of graduated cylinder using clamp so that its base is flat on the lab bench. Mark this point of clamp attachment on the lab stand with a sharpie as the “0” line.
3. Using the measuring tape, mark 5 cm increments up from the “0” line to the top of the stand. Raising the graduated cylinder will allow you to generate increasing pressure heads for the calibration curve.
4. Place strip of lab tape along the length of the graduated cylinder. Record the height of water meniscus in the graduated cylinder while level on the lab bench at the “0” line on the lab stand. Enter meniscus height in cell C4 of the calibration sheet.

Figure 18. Transducer calibration. Note labeling of lab stand and graduated cylinder. The graduated cylinder is raised 5 cm, and the meniscus in the graduated cylinder is 10 cm high, so the total height is 15 cm.
5. Measure the height of the transducers on the manifold above the lab bench, to the middle of the transducer barb. Enter this height in cell D4 of the calibration sheet. We mount ourmanifold on an upside down petri dish lid to keep the transducers out of any water on the bench and to maintain a standard height. This height is then subtracted from the total height for the pressure head.

Figure 19. Transducer calibration. Measuring the height of the transducers above the bench.
6. Wait for a stable measurement of Tr0 and Tr1 voltages, and enter these in columns A and B with graduated cylinder reservoir at “0” height, then record readings at increasing heights in intervals of 5 cm as you raise the reservoir. Allow the readings to plateau before recording voltage. Enter height increments in column E. Total height will be calculated in column F: Total height = (meniscus height – transducer height) + extra height

Figure 20. Transducer calibration. Raising the graduated cylinder for another calibration point.

Figure 21. Transducer calibration. Screenshot of calibration spreadsheet and LabView while measuring different points for calibration.
7. The Calibration spreadsheet will plot voltage against total height and fit a regression through your points, for both P0 and P1. Enter the slope and intercept of both regressions calculated in cells C14-C19 into the LabView virtual instrument. This will automatically convert voltages into bars by multiplying the transducer output voltage by the slope and adding the intercept.
8. Since both transducers are now calibrated against the pressure head, P0 = P1. To check accuracy, move graduated cylinder to an intermediate height and ensure P0 and P1 values are comparable and are the same as the pressure value in your spreadsheet for that height in the calibration curve.
9. Troubleshooting:If one or both transducers are not responding to applied pressure, first check for a loose connection, e.g. ensure wires are making contact with DAQ board. Tighten if necessary. If there is still no response, check for air bubbles in the system and flush (first close stopcocks to transducers), or air bubbles in the transducers themselves (return to Section II, step 15).
VII. MAKING MEASUREMENTS WITH YOUR FLOW METER
Once your flow meter has been sterilized, set-up and connected to the voltage source and the signal is being read by LabView, and the transducers are calibrated, you are ready to start making measurements!
1. Fill a basin or petri dish with ultrapure water. This will be used to attach sample fittings to the flow meter and connect samples under water.
2. Set pressure head by raising the graduated cylinder to an appropriate height on the lab stand. Record the pressure head.
3. Choose and attach a piece of tubing with attached female luer fitting such that the tubing has an internal diameter similar to the diameter of the petiole or stem segment you will measure. If you are using soft tubing, which is best to make a tight seal on the plant sample, make sure to minimize the tube length so that there is minimal tubing length empty between the sample and the barb of the fitting (because soft tubing will expand and contract, increasing the time for flow to stabilize).

Figure 22. Leaf with parafilm wrapped around petiole, and sample tube prepared with soft tubing, ready for sample to be sealed
for hydraulic conductance measurement.
4. Use syringe 2 to flush sample tubing with degassed solution to remove any air bubbles.
5. Wrap parafilm around your petiole or stem sample (with bark and phloem removed from stem end), and use a fresh razor blade to recut the tip under ultrapure water. We suggest to use a piece of parafilm short enough that it will wrap around the sample no more than twice, and to first fully stretch out the parafilm in your fingers before wrapping it around.
6. Close stopcocks to syringes, open stopcocks to reservoir, transducers, resistance tubing and sample (solution will begin to flow so be ready to connect your sample immediately!). Your manifold should look like this with water flowing along the blue arrow:

Figure 23. Configuration of flow meter during the measurement.
7. Insert sample into tubing under water avoiding any contact between the cut end and the walls of the tube. Ziptie around the tubing over the sample to secure and prevent leaks. You can gently lift connection out of water to check for leaks (e.g., by drying around the seal with a tiny piece of paper towel and opening stopcock 5 to the syringe and closing it to the rest of the system, and gently squeezing). However, do not raise sample above pressure head or air may be pulled out of the airspaces in the sample and introduce a bubble into the tubing or xylem.

Figure 24. Sample sealed into tubing.
8. NOTE: Attaching your sample in this way will exert some hydraulic pressure on the sample (i.e., that of the pressure head plus that of the pressure exerted when inserting the sample into the tubing). If you are concerned about this refilling embolism in your sample, then you can avoid imposing this pressure by attaching the sample with a different configuration. Add a 4-way stopcock to the tubing before the sample, and after filling this fitting and the tubing to the sample, put both under water in the basin. Shut the extra stopcock off to the flow meter system, but leave it open to the tubing running to the sample, and open to the water in the basin. Then, when pushing the sample into the tubing, the pressure can dissipate out of the open stopcock to the basin. Closing the stopcock off to the basin will then restore the flow pathway from the system to the sample.
9. Turn on LabView to measure hydraulic conductance. Take measurement for at least five minutes. For a steady-state measurement wait until your coefficient of variation is < 0.05. In the “K measurement” spreadsheet enter the P0 and P1 values in cells B4 and C4, final K “rough” value in cell E4, the final coefficient of variation in cell F4. (Later, the output spreadsheet logged from LabView can be opened, and these values can be replaced by mean values for the last 5 minutes of stability). Additionally type the PEEK tubing resistance, normalized to 25oC, into column J of the spreadsheet.
10. After stability, the P2 should be measured. This is the backpressure exerted by the water in the sample basin on the hydraulic stream. To measure P2, turn stopcock4 off to the system, and open only to the transducer and the sample. This way Tr1 will simply measure the pressure exerted by the head of the water in the basin. Enter P2 into column L in the spreadsheet.
11. Because the viscosity of water changes non-linearly with temperature, we measure temperature and normalize our conductance measurements to a standard temperature of 25°C. It is important to correct for the effect of temperature on the conductance both of the PEEK resistance tubing, and of the sample. You can use a thermometer to measure water temperature of the solution upstream and downstream of the PEEK tubing (by removing the syringes and measuring the water in the open ports), and of the water in the sample basin after each measurement. Enter those values in cells M4, N4 and R4 of “K measurement” sheet.

Figure 25. Measuring temperature of flow solution.
12. To correct for passive water uptake through the sample (Torres-Ruiz et al. 2012), repeat steps 2-11 twice using two different pressure heads. Plot K vs the pressure head in excel. Report K as the slope of the regression.
13. Close stopcocks to sample when switching between samples to conserve water supply. Flush sample tubing before connecting next sample.
14. Measurements of the diameter of stem and pith and stem length (using calipers), and the downstream leaf area (with a flatbed scanner or leaf area meter) will allow determination of hydraulic conductivity, and conductivity normalized by sapwood area or leaf area, and of Huber value. These calculations can be done using the “K measurement” spreadsheet.
15. Replace ultrapure water in the basin or petri dish in between measurements so that when recutting another sample underwater, it will be very clean.
Links to resources and suppliers
Additional attached files
1. Voltage regulator board circuit diagram, “Voltage Regulator Circuit 9V” by John Milligan, UCLA
2. Calibration and calculation spreadsheet, “Kstem_measurement”
3. LabView virtual instrument for Kstem measurement, “Kstem.vi”
Literature references
Melcher PJ, Holbrook NM, Burns MJ, Zwieniecki MA, Cobb AR, Brodribb TJ, Choat B, Sack L. Measurement of stem xylem hydraulic conductivity: field instrumentation and implementation, to be submitted.
Torres-Ruiz JM, Sperry JS, Fernández JE (2012) Improving xylem hydraulic conductivity measurements by correcting the error caused by passive water uptake. Physologia Plantarum 146:129-135