Within the manual Protocols for experimental plot sampling, handling and processing of cereals in field experiments![]() by G.J. Rebetzke (Greg.Rebetzke@csiro.au), A. van Herwaarden, B. Biddulph, C. Moeller, R. Richards, A. Rattey and K. Chenu.
by G.J. Rebetzke (Greg.Rebetzke@csiro.au), A. van Herwaarden, B. Biddulph, C. Moeller, R. Richards, A. Rattey and K. Chenu.
This section intends to provide a brief overview.
Why measuring soil water Knowledge of changes in soil water content is used to estimate the agronomic water-use efficiency, determine the plant available soil water capacity of a specific soil type, compare the timing of crop water-stress between treatments, manage the timing and amount of irrigation, and measure soil water storage for water-balances.
3.1 – Initial soil water – Soil cores
EM38 maps and soil cores taken around sowing help to characterise the experimental site. Depending on the size of the field, 5-10 cores should be collected across the experimental site.
- Select representative units in the paddock. Ideally, this selection would be based on EM38 maps (Note that EM38 measurements can depend on soil texture, clay content and soil water content so be wary of interpolating across fields and sometimes even within large fields).
- Use a core of known diameter (typically 37 or 50 mm) to sample the soil. Cut the core at set depth intervals, typically 0-15, 15-30, 30-60, 60-90, 90-120,120-150, 150-180 etc. Some of these holes can be used to install the neutron probe and the measurements can be used for neutron probe calibration (see below).
- For each depth intervals, subsamples can be taken for chemical analysis (e.g. pH, EC, Cl and NO3 etc). The subsamples can also be bulked across cores if desired. Dry for 4-5 days at 40∘C and analyse for EC, chloride, pH, NO3… (see Appendix 4
") ).
). - To measure soil water, put the remaining soil samples in plastic bags or foil-lined bags and seal. Weigh the samples. Unseal them prior to drying at 105∘C for about 48 hours, and weigh again (calculation described in Table 3).
3.1 – Soil water over time – Neutron Probe Moisture Meter (NMM)
Knowledge of radiation safety is essential for users of Neutron Probe Moisture Metres (NMM). The probe emits neutrons, which are uncharged, highly penetrating particles representing a radiation hazard. Thus, prospective users must undergo registered training (e.g. at ANSTO) to comply with OH&S regulations. Users should further refer to the regulations related to storage, transport, containment, and labelling.
Theory: The NMM allows measuring the volumetric soil water content in the field at user-defined depth intervals. Routine measurements can be taken non-destructively, which is why NMMs have been widely used to measure soil water in field experiments (Fig. 28). The NMM emits fast neutrons which collide non-elastically with hydrogen (H) atoms in the soil. The neutrons are -bounced’ off the H, and are reflected back at slower speed. Most of the H atoms in soil come from water (H2O). In the NMM method the measurement of the slow(ed) neutrons is used to calculate the soil moisture content.
 |
 |
Figure 28. Operation of a Wallingford NMM in the field and Excel sheet with the count data and conversion of counts into volumetric soil water contents.
To obtain the volumetric soil moisture content, the count rate is multiplied by a calibration equation. The calibration equation is specific for a particular soil type and has usually the following form:
- Volumetric Soil Water Content = Count Rate Ratio * Slope + Intercept
- = R / RW * Slope + Intercept
R: count rate measured at different depth intervals over a soil profile
RW: standard count taken in a large volume of water. To obtain RW, the NMM is mounted onto a 200 l barrel of water (after the instrument has been serviced). Counts are taken at the centre of the water body. There should be little variation between repeated measurements of RW – if this is not the case the probe must be checked.
If the calibration equation is known, the NMM readings taken at various depth intervals in the field are converted into volumetric soil water contents as shown in Table 1.
Table 1. Conversion of NMM counts (R) into volumetric soil water contents (Vol. %). The calibration equation in this example is Vol.% =( R/974 * 0.76-0.052) *100. RW=974; slope=0.76; Intercept=-0.052.
 |
Why is there the need for a calibration equation The dry soil matrix produces its own background noise, which contributes to the count rate. This background noise differs with the soil type (e.g. clay, loam, or sand). Thus, a unique calibration relationship between count rate and water content is required for every soil.
NMM calibration: As part of the calibration, soil water is measured gravimetrically on samples taken from around several access tubes at different times in the season. At the same time the counts from the NMM are recorded.
Selection of sites and sampling procedure for calibration:
- Select representative units in the paddock. Ideally, this selection would be based on EM38 maps.
- Across the paddock, select 3 sites (i.e. access tube points) per unit. Take the GPS coordinates of the selected sites.
- At each site, insert aluminium access tube/s to the potential depth of crop rooting (1-6 – 2.0 m in most soils). – in an existing experiment, 1-2 temporary access tubes (A, C Fig. 28) can be installed close (1 m) to a permanent access tube (B; Fig. 25). – generally, several (2-3) access tubes/site (1 m apart) will allow to capture small scale variability – one access tube/site might suffice in uniform soil.
- Use an auger of known volume to sample the soil for each depth interval from close around the tube/s (tubes A and C in Fig. 29). Typical depth intervals are 0-15, 15-30, 30-45, 45-60 cm, etc.
- Due to soil heterogeneity and sampling errors (e.g. compression of samples despite best care), many sampling points (5 and more) are required for each site, depth, and sampling date.
- Discard bad samples (e.g. shattered) on the spot but make sure that the number of replications per tube is at least 3.
- The gravimetric soil samples must span a wide range of water contents ranging from dry, intermediate, to wet profiles. To achieve this samples are taken at different dates during the season/year. However, it may be necessary to generate the wet profile by irrigation.

Figure 29. Schematic representation of five sampling points at each access tube A and C. Several access tubes and many sampling points allow addressing soil heterogeneity and improving the quality of the calibration.
Record the count data for each depth interval on each sampling date. The NMM does not return reliable readings in the top 15 cm of wet soil and 30 cm of very dry soil. Thus, soil water in the top soil layer needs to be estimated gravimetrically (Table 2).
Table 2. Example form to record count data for calibration purposes.
 |
In the lab, the weight of wet soil samples is recorded before drying to constant weight at 105∘C. Drying time depends on soil type: 1 day for light soil and 2 days for heavy clay soil. Record all the data required for each individual field calibration point (site x depth interval) as given in Table 3.
Table 3. Example form to record all data required for one calibration point.
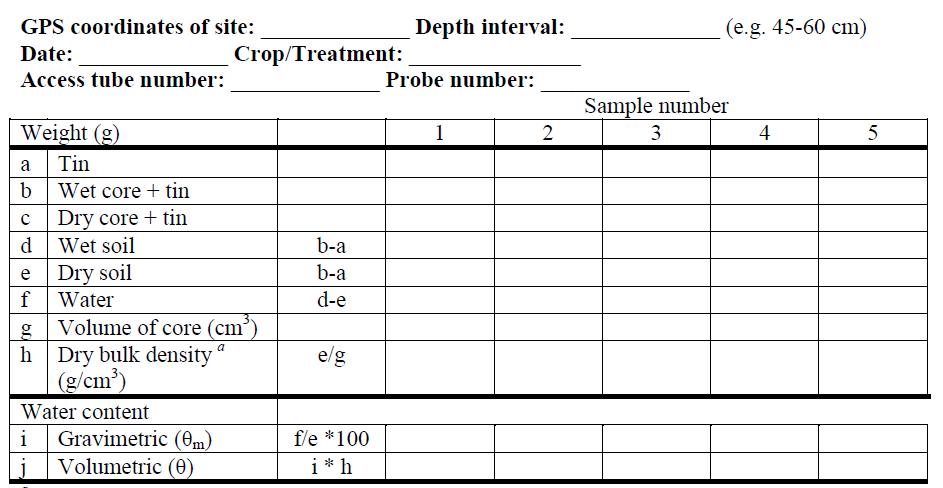 |
aThe determination of bulk density (BD) for each sample is suitable for rigid soil in which the BD is the same at any soil moisture content. In contrast, the BD in shrink-swell soil varies with moisture content and is done only on samples collected from wet soil (close to/at drained upper limit).
Finally, the Calibration Equation is derived by plotting the Volumetric Soil Water Content (θ) against the Count Rate Ratio (R/RW) and fitting a linear regression line: y = ax + b (equation as explained above).
3.3 – Drained upper limit (DUL) and crop lower limit (CLL)
Given the climatic conditions, the drained upper limit (field capacity) and the crop lower limit might not have been reached during the experiment.
Method:
- Drained upper limit: on bare soil (i.e. can be done before sowing), lay out a trickle irrigation system on 4 x 4 m area and attach to a reservoir (e.g. 1000L). Lay a heavy duty plastic sheet on top to avoid evaporation. Bury the edges ~15cm deep. Remove all vegetation within 2m, so that no roots can access the water (Fig. 30). Ideally, install a neutron probe in the middle of the trickle irrigation system to monitor change in soil moisture. Irrigate up to soil saturation (for heavy soils, irrigate at least twice, weeks apart, to allow time for drainage through the profile). Leave to drain (from 2-3 days for free-draining soils like sand up to a few weeks for heavy-clay soils). Do a soil core sampling to measure soil water moisture and bulk density at standard depths (Table 3). When the trials with heavy-clay soils are remote, refill the reservoir at flowering and measure at maturity, while doing the other soil cores (this avoid doing extra trips).
- Crop lower limit: at flowering, install a 3 x 3m tent above some plants to protect from rain (Fig. 30). Leave the plants to dry the soil and take three soil cores close to the middle of the area, at maturity to measure soil water content at the standard depths.
 |
 |
Figure 30. Pond (4x4m, left) and tent (3x3m, right) installed to measure drained upper limit and crop lower limit of the soil.
Further reading
Bell JP (1987) Neutron probe practice (3rd edition). Institute of Hydrology, Wallingford.
- – This is a guide to the practical use of neutron probes, the working principles and applications. (http://nora.nerc.ac.uk/5629/)
Dalgliesh N, Foale M (1998) ‘Soil matters: Monitoring soil water and nutrients in dryland farming.’ (APSRU: Toowoomba).
- – The handbook provides detailed descriptions of sampling procedures. Emphasis is placed on the northern region with its cracking clay soils. (http://www.apsim.info/Wiki/public/Upload/ApSoil/SoilMatters/)