 Protocol
Author
Hamlyn G Jones
OVERVIEW
Measurement of leaf temperature has traditionally been done by the use of fine-wire thermocouples attached to leaves, but it is difficult to scale this approach up to the estimation of plant or canopy temperatures. Infra-red thermometers have provided a tool for scaling up to plants and leaves, but the advent of relatively cheap thermal cameras (<$5,000) with a temperature resolution of <0.1∘C now allows one to study the temperature variation within and between plants. This protocol discusses some applications of infrared thermometry and thermography and some of the main factors that need to be considered when applying this to the study of leaf or canopy temperature whether in controlled environments or in the field.
BACKGROUND
There is much interest in measurement of the temperature of leaves, plants or canopies, primarily because of its importance as an indicator of leaf transpiration rate (and hence of stomatal opening and plant “stress”). This is used primarily in irrigation scheduling and in phenotyping for drought tolerance. Measurements of plant temperature are also useful in studies of freezing, energy balance and aerodynamic effects, and biochemical activity (especially relating to thermogenic respiration).
Infra-red sensing of temperature
Temperature sensing in the thermal infrared is based on the fact that all objects emit an amount of radiation (R; W m-2) that depends on the 4th power of the temperature (T; degree Kelvin) according to the Stefan-Bolzmann Law:

where is the emissivity and is the Stefan-Bolzmann constant (5.6697 x 10 x 8 W m-2 K-4). The emissivity is introduced to take account of the fact that not all surfaces are perfect emitters of radiation (i.e. black bodies). Emissivity relates the actual radiance for a body to the amount that would be emitted by a perfect emitter, and varies between 0 and 1 (for a perfect emitter or “black body”. The spectral distribution of the radiation emitted varies according to temperature of the surface, with emitters at the mean temperature of the earth’s surface (c.300 K) having a peak emission at a wavelength of 9.7 μm (Wien’s law). Radiation from the Sun, on the other hand, has a peak emission at c.500 nm (in the visible region), while that from a surface at 800 K has a peak around 3.2 μm.
Thermal cameras used for imaging vegetation in the field, therefore, need to be sensitive to long-wave thermal radiation (between 8 – 14 μm); other cameras (so called -short-wave’ thermal cameras sensitive to radiation between 3 and 5 μm) are available that are optimized for engineering applications where surfaces may be of the order 500 – 1000 K and are unsuitable for vegetation studies as they can detect reflected solar radiation, thus giving incorrect results when used in the daytime outdoors. Long-wave cameras are little affected by solar radiation and are therefore useful in the field.
Control of leaf temperature
The leaf temperature (Tl) at any time is dependent on the leaf energy balance and is given by the following equation

where Ta is the air temperature (K), Rni is the net isothermal radiation absorbed by the leaf (W m-2), D is the atmospheric air humidity deficit (Pa), is the density of air (kg m-3), cp is the specific heat capacity of air (J kg-1 K-1), s is the slope of the curve relating saturating water vapour pressure to temperature (Pa ∘C-1), is the psychrometric constant (Pa K-1), rHR is the parallel resistance to heat and radiation transfer, raW is the boundary layer resistance to water vapour transfer, and rs is the stomatal resistance to water vapour transfer (see Jones, 1992 for details, where the use of net isothermal radiation is explained in detail).
Evaporation rate, as determined by stomatal aperture, is a major factor determining leaf temperature. Hence thermal imaging is widely used to estimate evapotranspiration (ET) from crops or vegetation. The other most common application is in the detection of crop stress (especially water deficit stress).
MATERIALS/EQUIPMENT
- Any long-wave (sensitive in the waveband 8-14 μm) thermal camera having a thermal resolution of 0.1K or better. Lower temperature resolution cameras cannot usefully discriminate temperatures arising from small changes in stomatal aperture.
- It is useful to have a high accuracy temperature reference surface for calibration for absolute measurement – though in most applications high absolute accuracy is not required (especially where the reference surface approach is used)
- Temperature reference surfaces (wet and dry). These must have similar spectral properties to normal leaves, otherwise the temperatures achieved will not relate to the corresponding wet or dry leaf temperatures. It is common therefore to use actual leaves either sprayed with water (wet), or covered in petroleum jelly (dry). An alternative approach can be to use pale-gray card with a colour density chosen to mimic the leaf’s short wave absorptance. (See below for further precautions in the use of reference surfaces.)
UNITS, TERMS, DEFINITIONS
(i) Crop Water Stress Index (CWSI) = (Tcanopy Tnwsb)/ (Tmax Tnwsb), where Tcanopy is the canopy temperature, Tnwsb is the temperature of a non-water stressed reference crop under similar conditions, and Tmax is an upper temperature for a non-transpiring crop (see Idso et al. 1981; Jackson et al.1981).
(ii) As it is not usual to have a non-transpiring crop reference available it is more convenient to define an analogous stress index, SIcwsi = (Tcanopy Twet)/ (Tdry Twet), where Twet is the temperature of a wet reference surface and Tdry is the temperature of a non-transpiring dry reference (= Tmax; Jones 1999).
(iii) An alternative index that has the advantage of being proportional to stomatal conductance (Igs) is given by:

where 
and depends only on windspeed and to a lesser extent on air temperature, and is the latent heat of evaporation of water.
(iv) “Radiometric temperature” is the apparent temperature of an object or canopy as measured with an infrared thermometer. For a canopy this is not necessarily the same as the “aerodynamic temperature” which is the effective temperature for energy exchange, because for the radiometric temperature one only views the surface, while energy exchange may occur from hidden lower leaves also.
PROCEDURE
There is no single protocol for estimating leaf or canopy temperature by thermal infrared. Here we outline some of the key steps involved in the use of thermal imaging for the study of plant water stress and stomatal behaviour. It is useful, however, to treat thermal measurements on single leaves or small plants (e.g. Arabidopsis) in controlled environment chambers separately from field measurements of canopy temperature.
1. Setting up the thermal camera
The radiation received, and hence the temperature recorded, by the thermal camera depends on (a) the temperature of the object being viewed, (b) the emissivity ( ) of the object’s surface, (c) the incoming thermal radiation from the environment (background radiation) striking the object, and (d) on any absorption or emission of thermal radiation by the atmosphere between the object and the camera. Most thermal cameras come with software that allows one to correct for (c) and (d) given a knowledge of and the atmospheric humidity. Luckily, for most close range applications in plant science the error caused by (d) is small and can usually be neglected.
Choice of value for emissivity. For single leaves, typical emissivities are between 0.95 and 0.98 (Jones & Vaughan, 2010), so in the absence of any more precise information a value of 0.965 is recommended. Note that emissivities appropriate to soils tend to be only slightly lower (say 0.94-0.95) but with sands averaging as low as 0.89. When one views a canopy of leaves from a distance, however, the effective emissivity is higher than that of the component leaves, averaging approximately 0.99 (see Jones & Vaughan, 2010).
Correction for the background radiation. It is difficult to estimate the background (incoming to the object) thermal radiation accurately, but one approach to its estimation is to measure the apparent temperature of some crumpled aluminium foil placed in the position of the object (using an emissivity of 1) – the measured temperature is the effective background temperature (Tb) for use in the camera’s software. (For a leaf within a canopy Tb should be close to canopy temperature, while at the surface of a canopy Tb may be closer to the sky temperature which may be as low as -40° for clear sky.)
2. Separating leaf and canopy temperature from background
An advantage of using thermal imagers as compared with simple infrared sensors is that the images allow the user to distinguish leaves from background soil. There are a number of ways in which the information on leaf temperature may be isolated from a complex thermal image including soil and other objects.
Overlay with visible image. The simplest approach is to overlay the thermal image with a visible image of the same scene (many thermal cameras come with a built-in visible digital camera in addition). A number of methods are available for this that include: automated image recognition and alignment algorithms (e.g. Wang et al., 2010), freeware implementations of such alignment programs (e.g. using the Fiji image analysis platform – https://fiji.sc/), or the utilisation of the high reflectance of leaves in the near IR in the form of some vegetation index approach (e.g. Jones & Leinonen 2003).
Use of temperature histograms. An alternative is to make use of the expectation that leaves will generally be substantially cooler than the background soil, and use histogram thresholding to determine which pixels to use (e.g. Jones et al. 2002). In a related approach, Guiliani & Flore (2000) used a high temperature background screen to facilitate the use of thersholding to extract canopy temperature.
REFERENCE SURFACES
As indicated above, whether one is attempting to derive a Crop Water Stress Index or to estimate stomatal conductance directly, it is necessary to have estimates of the temperatures of wet and dry reference surfaces, or at least of a dry reference surface (Leinonen et al. 2006; Guilioni et al. 2008). The use of reference surfaces provides a ready normalisation of data, both for incoming radiation, and for any absolute measurement errors. The appropriate choice of reference surface depends on the scale of observation, with large areas of well-irrigated reference crop being ideal for satellite scale observations, but single water-sprayed or petroleum-jelly-covered leaves have proved very convenient for use for single leaf studies (e.g. Jones et al. 2002; Jones 2004; Leinonen et al. 2006). An example of the use of -wet’ and -dry’ areas on grapevine leaves is shown in Fig. 1.

Fig. 1. Illustration of the use of non-transpiring (Petroleum-jelly-covered) and wetted areas as temperature references for thermography of grape-vine leaves.
Meron et al. (2003) and Möller et al. (2007) have proposed the use of a large wet artificial reference surface (WARS) for use with airborne imagery. The WARS was constructed as follows: a 5 cm thick slab of expanded polystyrene foam was floated in a 40 x 30 x 12 cm plastic tray, covering most of the water surface. It was coated with a doubled piece of 0.5 mm thick water absorbent non woven polyester and viscose mixture cloth (Spuntech, Israel), overlaid on another 2 mm thick polyester non-woven water-absorbent cloth.
Unfortunately the behaviour of the reference surfaces is very dependent on the spectral absorptance properties of the reference, with white (reflective) surfaces tending to be much cooler than the true reference (leaves) and black surfaces being much hotter – see Fig. 2. It is also worth noting from this figure that the reference temperature is much more sensitive to radiation as it becomes more absorptive. It follows that great care is needed to ensure that whatever reference surface is used has the correct short-wave radiative properties. A further area where care is needed is in the orientation of the reference surface used. For single leaf studies, the reference -leaves’ should clearly be maintained in the same orientation with respect to the solar beam as the leaves being studied. For a canopy with randomly oriented leaves, however, it is the average temperature across all leaf orientations that is appropriate. One approach to estimation of this is to use a reference surface that averages the temperature of differently-oriented surfaces (B R Loveys and H G Jones, unpublished).
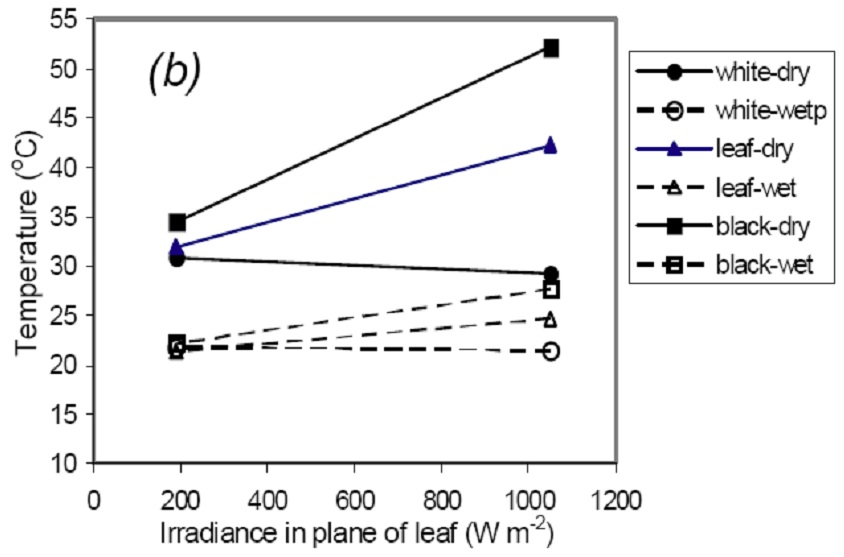
Fig. 2. Observed relationship between surface temperature and irradiance for the three types of reference surface (white filter paper, black filter paper and real leaves (wetted or covered in petroleum jelly) when wet or dry. From Jones et al. (2009).
NOTES AND TROUBLESHOOTING TIPS
Bidirectional reflectance effects and choice of view angle
When studying canopies in the field it is important to note that the apparent radiometric temperature of the canopy may change depending both on the view angle and on the solar angle, because it depends on the fraction of (cooler) shadows in the image which will be negligible when the sun is behind the viewer, but substantial when viewing towards the sun.
In practice one has to decide between viewing canopies from the sunlit side, or the shaded side. The greatest sensitivity of temperature to stomatal conductance is for leaves oriented to face the sun (e.g. Fuchs 1990), but there can be advantages to measurement on the shaded side of canopies because one expects leaf-leaf variability to be smaller in such situations (Jones et al. 2002).
Thermal dynamics
A problem in field application to crops is the fact that canopy temperatures are rarely stable because of wind currents and the fact that irradiance is constantly changing. There is a substantial time-lag of canopy temperature to changing irradiance (up to several minutes); this lag may be different from that of the reference leaves.
(It is theoretically possible to estimate stomatal conductance or boundary layer conductance from the time constants of temperature changes of dry, wet and transpiring leaves, but I am not aware of any successful practical application of this approach.)
LINKS TO RESOURCES AND SUPPLIERS
There are a number of manufacturers of thermal imaging cameras. These include:
FLIR http://www.flir.com/aboutFLIR/;
Infratech http://www.infratec.de/;
Infrared Cameras Inc. http://www.infraredcamerasinc.com/;
LITERATURE REFERENCES
Fuchs M (1990) Infrared measurement of canopy temperature and detection of plant water stress. Theoretical and Applied Climatology 42, 253-261.
Giuliani R, Flore JA (2000) Potential use of infra-red thermometry for the detection of water stress in apple trees. Acta Horticulturae 537, 383-392.
Guilioni L, Jones HG, Leinonen I, Lhomme JP (2008) On the relationships between stomatal resistance and leaf temperatures in thermography. Agricultural and Forest Meteorology 148, 1908-1912.
Idso SB, Jackson RD, Pinter PJ, Reginato RJ, Hatfield JL (1981) Normalizing the stress-degree-day parameter for environmental variability. Agricultural Meteorology 24, 45-55.
Jackson RD, Idso SB, Reginato RJ, and Pinter PJ Jr (1981) Canopy temperature as a drought stress indicator. Water Resources Research 17, 1133-1138.
Jones HG (1992) Plants and microclimate (2nd edn). Cambridge University Press, Cambridge.
Jones HG (1999) Use of thermography for quantitative studies of spatial and temporal variation of stomatal conductance over leaf surfaces. Plant, Cell & Environment 22, 1043-1055.
Jones HG, Stoll M, Santos T, de Sousa C, Chaves MM, Grant OM (2002) Use of infrared thermography for monitoring stomatal closure in the field: application to grapevine. Journal of Experimental Botany 53, 2249-2260.
Jones HG, Leinonen I (2003) Thermal Imaging for the Study of Plant Water Relations. Journal of Agricultural meteorology 59, 205-214.
Jones HG (2004) Application of thermal imaging and infrared sensing in plant physiology and ecophysiology. Advances in Botanical Research 41, 107-163.
Jones HG, Serraj R, Loveys BR, Xiong L, Wheaton A, Price AH (2009) Thermal infrared imaging of crop canopies for the remote diagnosis and quantification of plant responses to water stress in the field. Functional Plant Biology 36, 978-989.
Jones HG, Vaughan (2010) Remote sensing of vegetation: principles, techniques and applications. Oxford University Press, Oxford ISBN 978-0-19-920779-4.
Leinonen I, Grant OM, Tagliavia CPP, Chaves MM, Jones HG (2006). Estimating stomatal conductance with thermal imagery. Plant, Cell and Environment 29, 1508-1518
Meron M, Tsipris J, Charitt D (2003) Remote mapping of crop water status to assess spatial variability of crop stress. Paper presented at the 4th European conference on Precision Agriculture, Berlin.
Möller M, Alchanatis V, Cohen Y, Meron M, Tsipris J, Naor A, Ostrovsky V, Sprintsin M, Cohen S (2007) Use of thermal and visible imagery for estimating crop water status of irrigated grapevine. Journal of Experimental Botany 58, 827-838.
Wang X, Yang W, Wheaton A, Cooley N, Moran B (2010) Efficient registration of optical and IR images for automatic plant water stress assessment. Computers and Electronics in Agriculture 74, 230-237.
HEALTH, SAFETY & HAZARDOUS WASTE DISPOSAL CONSIDERATIONS
None have yet been recommended for this protocol.